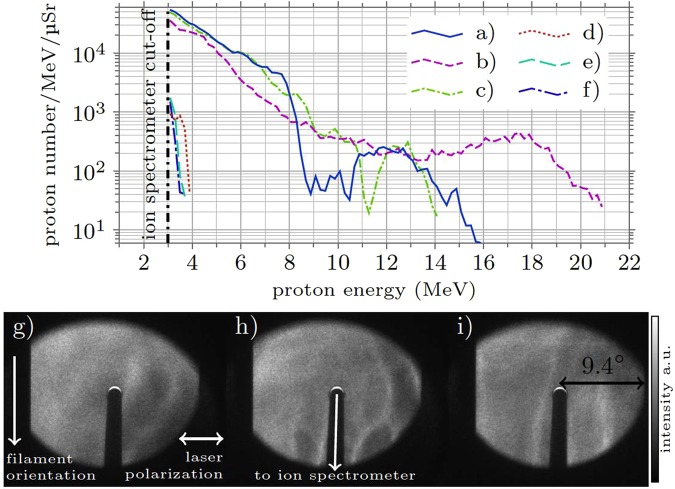
Figure 2.
Experimental results I. Proton energy spectra (a–f) and beam profiles (g–i). The spectra (a–c) and the corresponding beam profiles (g–i) were obtained with a temporal intensity contrast TIC = 3.6 × 10⁻⁹ at a time 30 ps before the main pulse (for a definition of the TIC see text). While the low-energy part of the spectrum in (a–c) shows an exponential decay, modulations are visible at higher energies. The scintillator images (9.4° half-opening angle) show beam profiles with no clear intensity drop towards the edges of the field of view, indicating an emission of protons into a significantly larger opening angle. Note that the scintillator’s rear side is imaged onto the CCD. The black shadow visible in the images of the beam profiles is due to the tube used as the ion beam guide towards the spectrometer, which blocks part of the image. The spectra (d–f) correspond to shots with TIC = 4 × 10⁻⁸. Here, only 5 out of 81 shots produced protons with energies only slightly above the spectrometer’s lower cut-off of 3 MeV.

