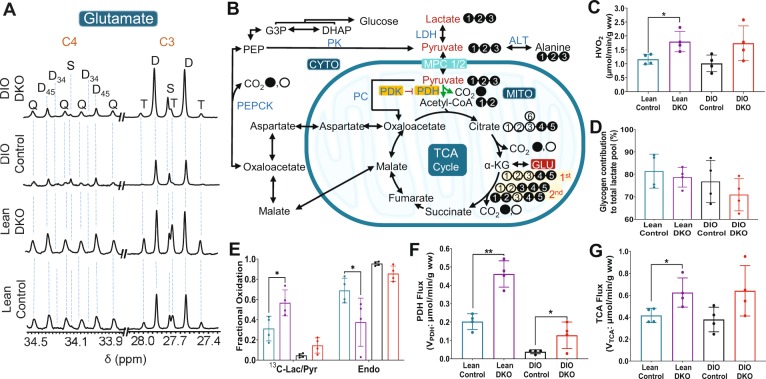
Figure 4.
Metabolic parameters obtained by 13C NMR isotopomer analysis of tissue glutamate. (A) glutamate C-4 (34.20 ppm) and C-3 (27.60 ppm) resonances; (B) a metabolic scheme showing 13C-labeling of glutamate isotopomers; (C) oxygen consumption; (D) contribution of glycogen to the total lactate pool; (E) fractional oxidation of 13C-lactate/13C-pyruvate and endogenous sources for energy production by the TCA cycle; (F) pyruvate dehydrogenase (PDH) flux; and (G) tricarboxylic acid cycle (TCA) flux. The letters S, D, T, and Q refer to a singlet, doublet (with the relevant J-coupled spins), triplet (a degenerate doublet of doublets), and quartet (or doublet of doublets), respectively. Filled circles in the metabolic scheme represent 13C-enriched carbons while open circles represent natural abundance levels of 13C. 13C-enriched pyruvate and lactate supplied in the perfusion medium are shown in red in (B). For viewing simplicity, only 13C-labeled glutamate isotopomers generated after the 1st and 2nd turns are shown. 13C-labeling patterns of other metabolites can be generated using tcaSIM and tcaCALC (downloadable free of charge at http://www.invivometabolism.org/tca.html. Abbreviations: α-KG = α-ketoglutarate; ALT = alanine transaminase; CYTO = cytosol; G3P = glyceraldehyde 3-phosphate; GLU = glutamate; LDH = lactate dehydrogenase; MITO = mitochondria; MPC1/2 = mitochondrial pyruvate carrier 1 and 2; PDH = pyruvate dehydrogenase complex; PDK = pyruvate dehydrogenase kinase; PC = pyruvate carboxylase; PEP = phosphoenolpyruvate; PEPCK = phosphoenolpyruvate carboxykinase, TCA = tricarboxylic acid; and gww = gram wet weight. The bar plots represent the mean ± SD (n = 4 per group) with significance indicated by “*” (P < 0.05) and “**” (P < 0.001).

