Figure 6.
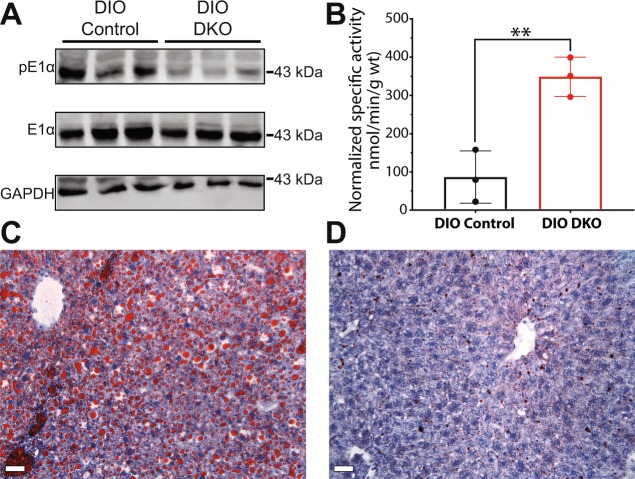
Western blots, specific activity, and histology. (A) Western blots showing phosphorylated PDH E1α subunit (pE1α), total phosphorylated PDH E1α subunit in tissue lysates from DIO control and DIO DKO livers (n = 3 livers). GAPDH serves as a loading control. The images were collected from three gels. Raw images of these three gels are shown in Supplementary Information (Fig. S5). (B) PDH specific activity; Representative Red Oil O stains from (C) DIO control and (D) DIO DKO livers. The red color in each image is attributed to stained lipids within the liver. The scale bars are 20 µm. The bar graph in (B) reflects the mean ± SD (n = 3 per group) with a statistical significance of differences indicated by “*” (P < 0.05) and “**” (P < 0.001).

