
Fig. 1. Permutation-based quantile–quantile plot showing that the observed p values (blue circles) considerably differ from a random distribution under the null hypothesis (solid diagonal line).
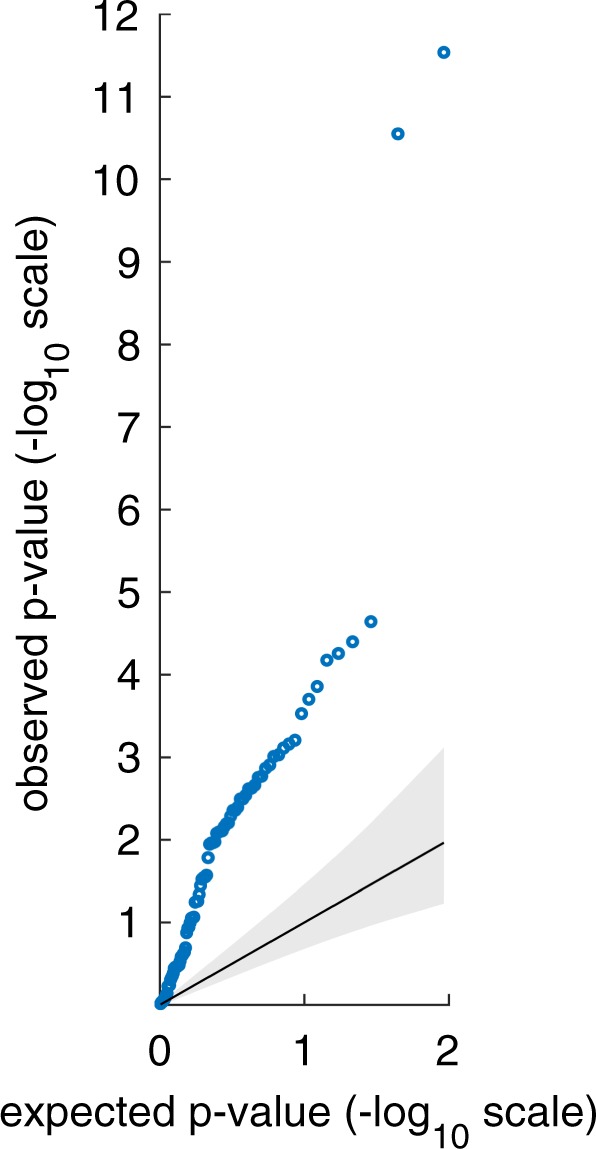
For the set of 84 observed p values (21 sleep variables × 4 personality scores), one million sets of 84 expected p values were derived after data permutation. During data permutation, original correlations within the domain of hypomanic personality variables and the domain of sleep variables were preserved while original correlations between the two domains were removed through random shuffling. Each set of p values was sorted in descending order. The solid diagonal line represents the mean expected p values at rank 1–84 plotted against themselves. The upper and lower bound of the gray area represent the 5th and 95th percentile of expected p values plotted against the mean expected p values. The blue circles represent the observed p values plotted against the mean expected p values