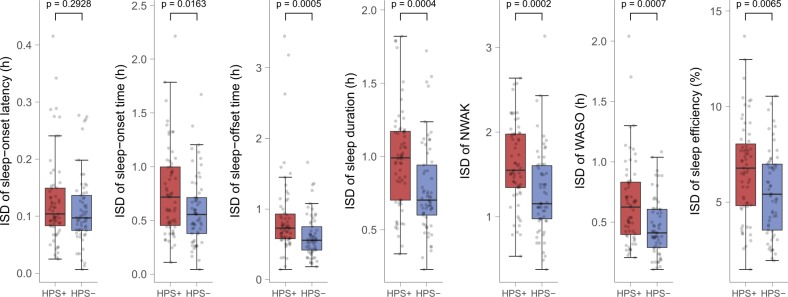
Fig. 2. Boxplots of intraindividual night-to-night variability of actigraphic sleep variables stratified by HPS extreme groups.
Intraindividual night-to-night variability is operationalized by intraindividual standard deviation (ISD) across a single subject’s multiple nights. Boxplots are stratified by top and bottom decile hypomanic personality scale (HPS) groups (HPS+, N = 63 vs. HPS−, N = 61). Boxes represent the interquartile range of each distribution (data between the lower and upper quartile), with the horizontal line corresponding to the median. Whiskers extend to the furthest observation within 1.5 times the interquartile range from the lower and upper quartile. Dots represent single data points, jittered horizontally to avoid overplotting

