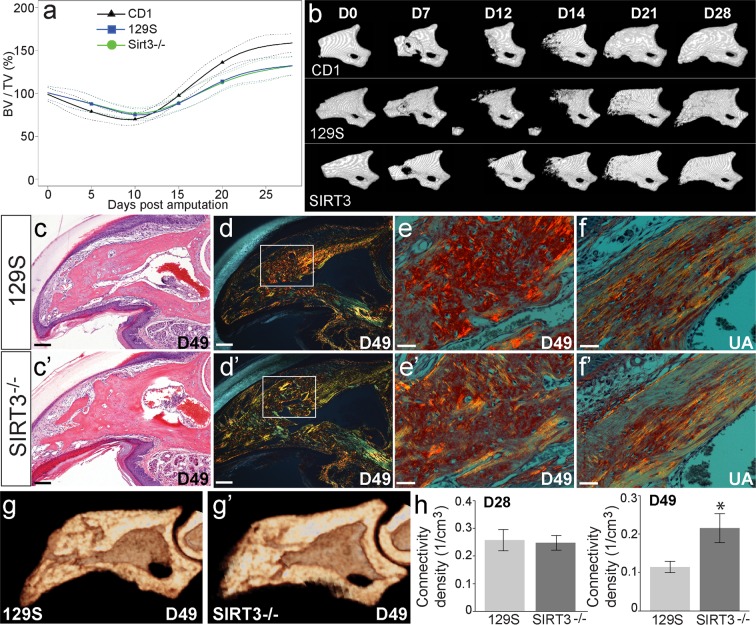
Figure 3.
SIRT3 is not a limiting factor in digit regeneration. (a) μCT analysis of changes in bone volume over time following amputation shows no significant difference between SIRT3−/− (green line circle) and 129S (blue line square) regenerative ability (N = 5 mice, N = 20 digits). CD1 outbred mice (black line triangle) are used as a standard amputation model for comparison (N = 4 mice, N = 16 digits). Data are normalized to amputated day 0 bone volume and analyzed using SS ANOVA models. (b) Representative μCT images of a regenerating P3 digit in CD1, SIRT3−/−, and 129S regenerates show no phenotypic differences at 28 days post amputation. (c,c’) H&E staining of day 49 sections of 129S (c) and SIRT3−/− (c’) mice. Scale bar represents 50 μm. (d,d’) Picrosirius red staining and polarized light microscopy show collagen fiber alignment in woven bone of the regenerated digits at day 49 in 129S (d) and SIRT3−/− (d’) mice. Scale bar represents 50 μm. (e’) Higher power images of d, d’ showing cross-hatched collagen alignment representative of woven bone in both 129S (e) and SIRT3−/− (e’) regenerates. Scale bar represents 30 μm. (f,f’) For comparison, polarized light microscopy shows parallel collagen fiber alignment in the cortical bone of unamputated digits in 129S (f) and SIRT3−/− (f’) mice. Scale bar represents 30 μm (g,g’) μCT cross-sectional analysis of regenerated digits at D49 to measure trabecular architecture in 129S and SIRT3−/− mice. (h) Quantification of μCT data reveals trabeculae with greater connectivity density in the SIRT3−/− mice compared to 129S controls at 49 days post amputation but not at 28 days post amputation. N = 4 for histology sections with representative images shown. Error bars represent SEM *p = 0.0162.

