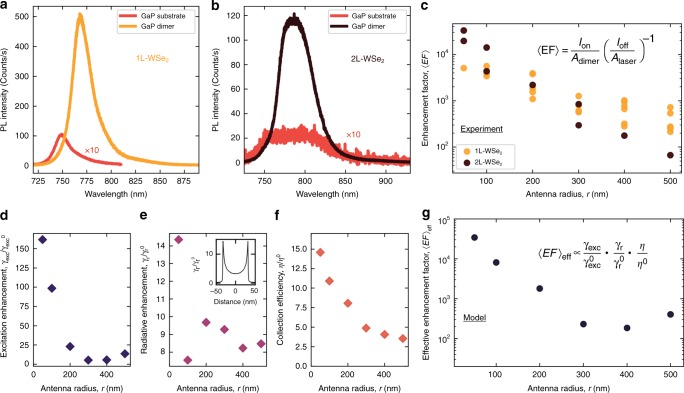
Fig. 2.
Photoluminescence enhancement of monolayer and bilayer WSe coupled to GaP nano-antennas. a, b PL spectra for 1L-WSe (orange) and 2L-WSe (black) placed on top of GaP nano-antennas with = 300 and 100 nm, respectively. Spectra in red are measured on 1L- (a) and 2L-WSe (b) placed on the planar GaP. Their intensity is multiplied by 10. c Experimental PL enhancement factor, , as a function of the antenna radius, for 1L- (orange) and 2L-WSe (black). d–g Results of simulations showing various parameters determining the observed PL enhancement in a dimer as a function of the pillar radius (see main text and ‘Methods’ for further details). The values shown in the figures correspond to the behaviour of an oscillating electric dipole placed at the edge of the gap between the two pillars, 0.5 nm above the top of the pillar, and aligned along the line connecting the centres of the pillars [see inset in e]. d Enhancement of the excitation, , dependent on the electric field intensity at the antenna surface and on the planar GaP substrate. e Enhancement of the radiative recombination rate, . Inset shows variation of this ratio as a function of the dipole position above the dimer gap. The values plotted in d–g are calculated for the dipole placed at the position where reaches the maximum. f Enhancement of the light collection efficiency, . g Dependence on of the calculated effective enhancement factor, , defined as the product of the parameters in d–f (see Eq. (2) and the formula on the graph)

