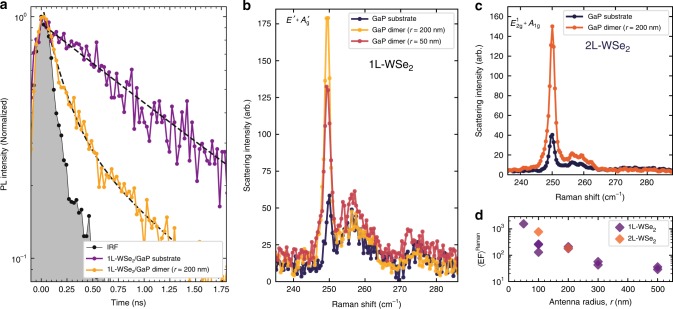
Fig. 4.
Time-resolved photoluminescence and Raman scattering spectra. a PL decay traces for a WSe monolayer placed on a planar GaP substrate (purple) and coupled to a nano-antenna with nm (yellow). Grey shows the instrument response function (IRF). The PL signal is measured with a 90-ps pulsed laser, under low excitation power of 0.2 W/cm, to avoid exciton–exciton annihilation processes. Resolution-limited dynamics are measured for WSe coupled to a dimer. Dotted black lines show results of the fitting with exponential decay. b Raman scattering spectra for 1L-WSe placed on GaP nano-antennas with r = 50 nm (red) and 200 nm (yellow) and on the planar GaP (black). c Raman scattering spectra for 2L-WSe on a = 200 nm GaP nano-antenna (orange) and on the planar GaP (black). d Experimental Raman enhancement factor, (see Eq. (3) in ‘Methods’), obtained (after background subtraction) for the 250 cm peak in 1L- and 2L-WSe coupled to nano-antennas with various

