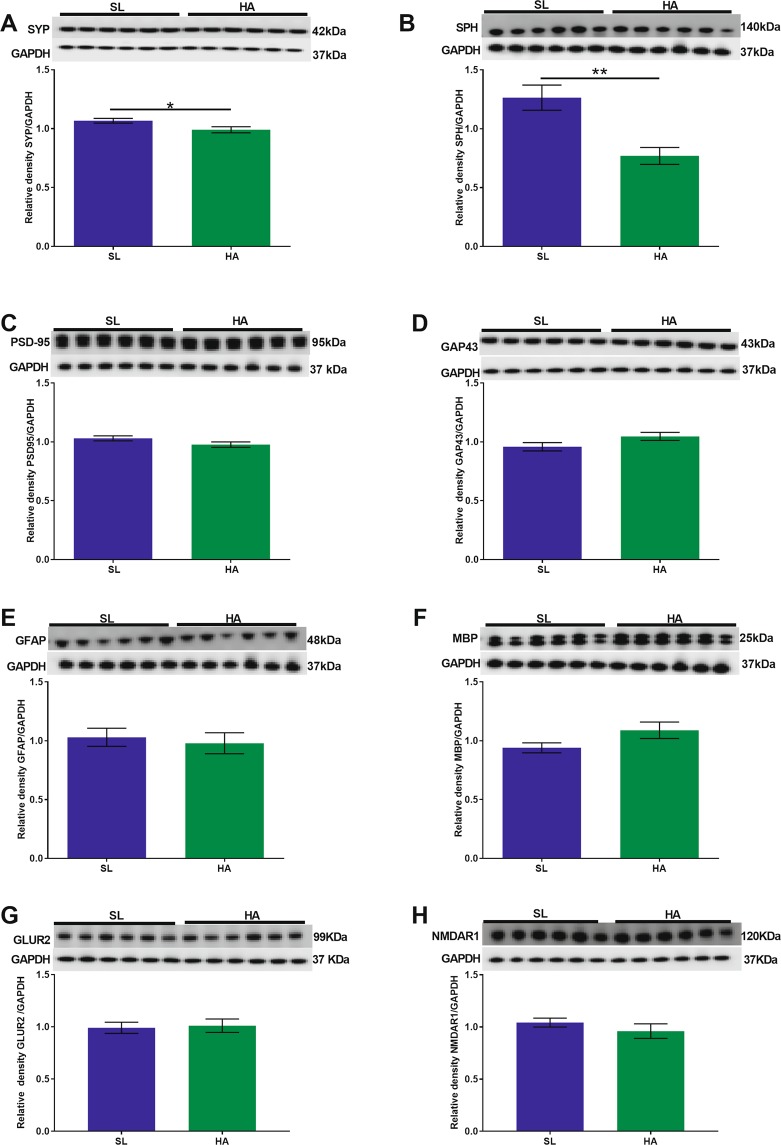
Figure 3.
CEHA results in a significant decrease in the expression levels of SYP and SPH in the olfactory cortex. WB analysis of (A) SYP, (B) SPH, (C) PSD-95, (D) GAP43, (E) GFAP, (F) MBP (G) GLUR2, and (H) NMDAR1 protein levels. No significant changes were observed in PSD-95, GAP43, GFAP, MBP, GLUR2 and NMDAR1 protein levels. Data are expressed as mean ± SEM, n = 6 animals per group. *p < 0.05, **p < 0.01. Full length blots are presented in Supplementary Fig. 1 (GAPDH was done on each blot after stripping the protein of interest on each corresponding blot).

