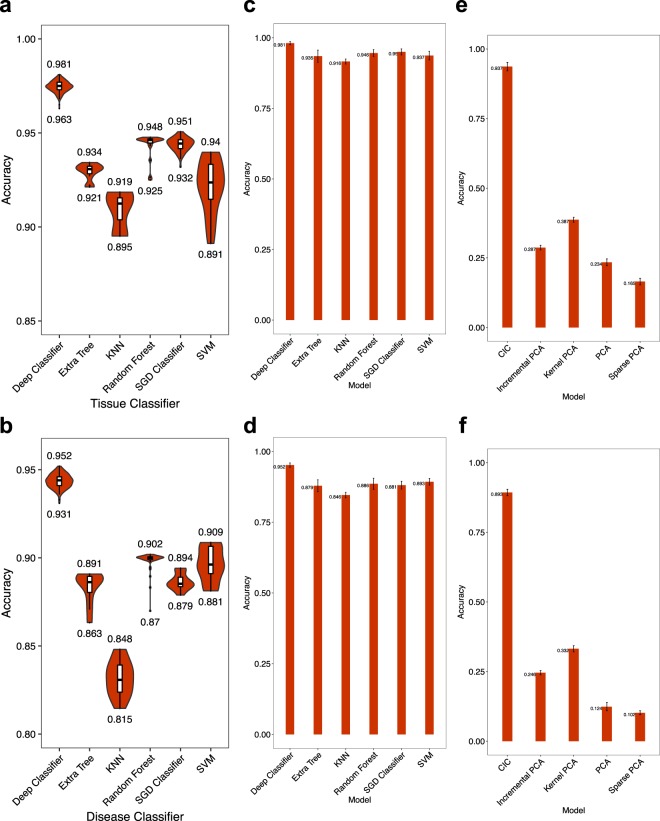
Figure 2.
Accuracy of the DNN, in comparison with classical dimension reduction and classification algorithms. (Left) Each shows the distribution of tissue (a) or disease (b) classification accuracy obtained by 200 iterations of hyperparameter optimization for each algorithm. The leftmost violin shows our DNN. The input to each algorithm is the whole mRNA EP, and the tissue or disease type is expected as the output. (Middle) Accuracy of the same algorithms for tissue (c) or disease (d) classification, when the input to each algorithm is the CICs obtained by DNN. The bar height and error bar length show the mean and standard deviation of 5-fold cross-validation results, respectively. (Right) Four different dimensionality reduction algorithms are compared with the CICs obtained by the DNN. For each algorithm, the dimension of mRNA EP is reduced to 8 (the same dimension of CIC). Given the 8-dimensional vector of each algorithm as the input, an Ensemble learning classifier is trained to predict the tissue (e) or disease (f) type. Bar heights and error bar lengths represent mean and standard deviation of accuracy in 5-fold cross validation. PCA = Principal Components Analysis; Kernel PCA = Non-linear version of PCA using kernels; Sparse PCA = implementation of PCA that finds a sparse set of components that can optimally reconstruct the data; Incremental PCA = PCA using Singular Value Decomposition (SVD) of the data, keeping only the most significant singular vectors, KNN = k-nearest neighbors, SGD = Stochastic Gradient Descent, SVM = Support Vector Machine. See scikit-learn manual for more details about these algorithms.

