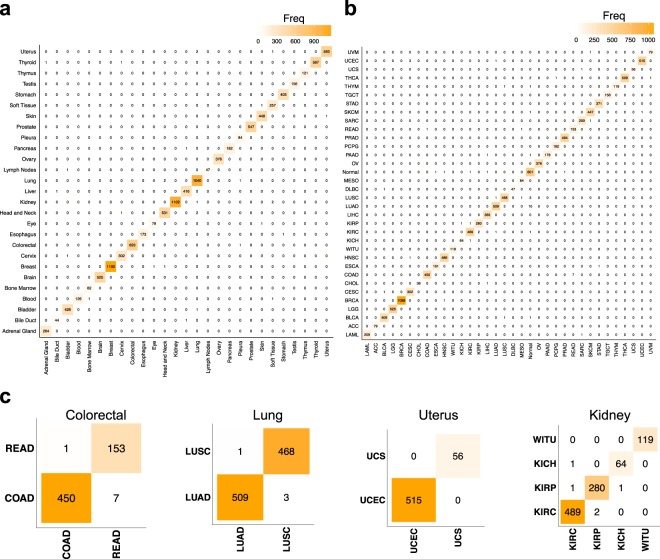
Figure 4.
Confusion matrices of tissue, disease, and disease sub-type classification. (a) Confusion matrix of tissue classification, in which the columns and rows represent the real and predicted tissue types, respectively. Each cell contains zero or some positive number of samples, and the diagonal and other cells represent correct and incorrect classifications, respectively. (b) Confusion matrix for classification of the disease type. (c) Confusion matrices for classification of cancer types/subtypes that originate from the same tissue and should be distinguished for appropriate clinical management. All tissues of the dataset having more than one cancer type are presented.

