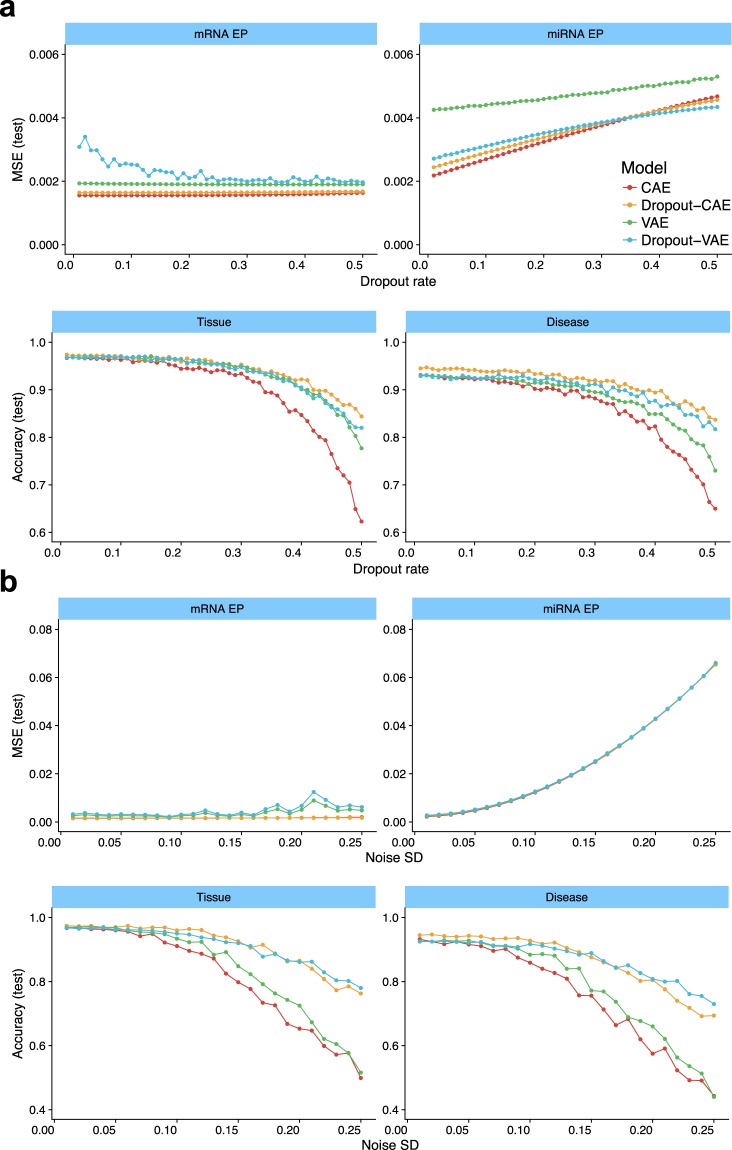
Figure 6.
The resistance of different DNN architectures against missing values and noise. (a) In each plot, the x-axis shows the fragment of randomly-selected input values that are set to zero (dropout), and y-axis shows either regression MSE or classification accuracy for the test dataset. (b) The x-axis shows the standard error (SD) of a zero-centered Gaussian noise which was added to the input values, and y-axis shows MSE or accuracy for the test dataset. Colors indicate different DNN architectures (see the figure legend).

