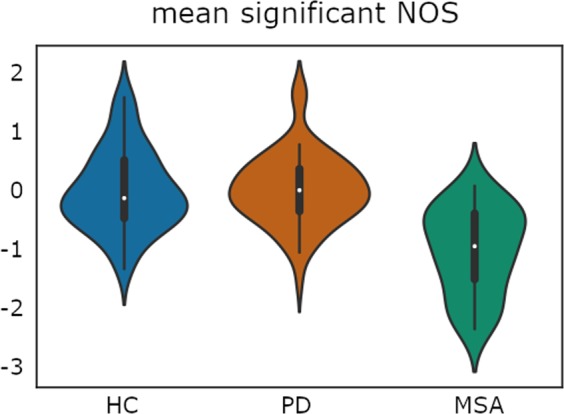
Figure 2.

Plot illustrates the distribution of the average number of streamlines (NOS) between the 10 significantly reduced tracts found in MSA patients using threshold-free network based statistics (TFNBS). NOS values were Z-transformed to calculate the global mean value comprising all significant connections; HC: healthy controls; PD: Parkinson’s disease group; MSA: multiple system atrophy group. Plot width represents the frequency (density) of values; the height indicates the upper (max) and lower (min) limits.
