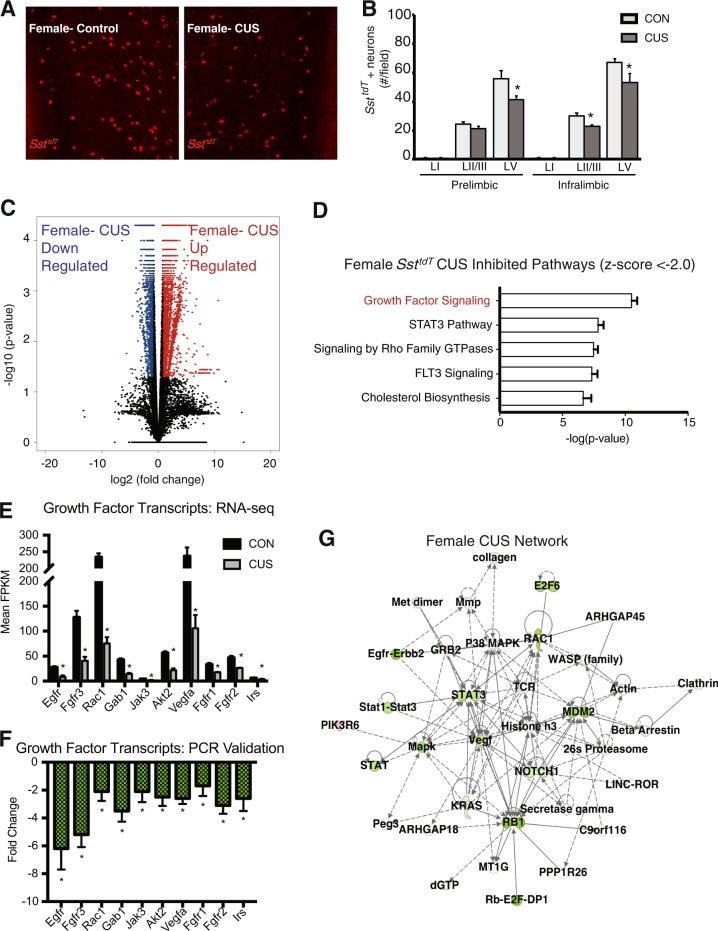
Fig. 4. Influence of CUS on female SsttdT interneuron transcript expression.
a Representative images of SsttdT interneurons in the infralimbic subregion of the medial PFC of female mice exposed to CUS or left undisturbed as controls. b Average number of SsttdT interneurons in each layer of prelimbic and infralimbic medial PFC are shown in bar graph. Bars represent the mean ± S.E.M. (n = 4–7/ group). Means that are significantly different from respective controls by ANOVA are noted by (*p < 0.05). c Volcano plots of differential gene expression between SsttdT interneurons of female control and CUS exposed. Red dots indicate upregulated transcripts and blue dots represent downregulated transcripts. There are 4642 DEGs (FDR < 0.05), n = 3–7 SsttdT males and females. d Top 5 significantly inhibited pathways in female SsttdT interneurons after CUS. The most inhibited (most downregulated genes) was the pancreatic adenocarcinoma signaling pathway comprised mostly of growth factors and growth factor signaling molecules. e Mean FPKMs of growth factor signaling transcripts decreased by CUS (FDR < 0.05) in the female CUS network; error bars indicate ± S.E.M. f Secondary confirmation of growth factor signaling transcripts in the SsttdT female CUS network by qPCR; error bars indicate ± S.E.M. of log corrected Ct values (n = 3, Mann–Whitney-U, p < 0.01). g Ingenuity pathway analysis generated a female CUS network centered on growth factors of the adenocarcinoma pathway. This network received a score of 17 and has 9 focus molecules with major hubs at Vegf and Rac1

