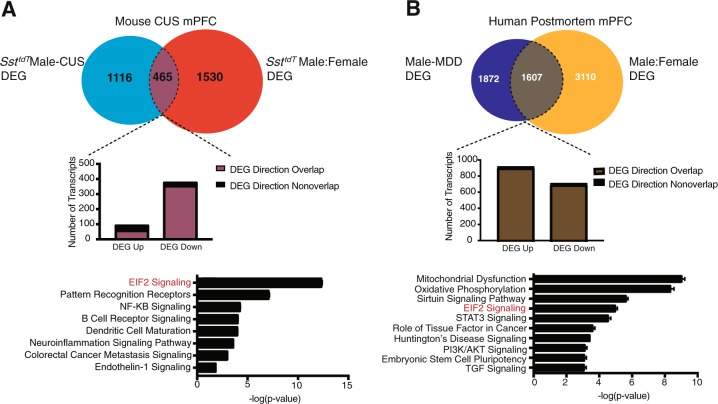
Fig. 5. Comparison between mouse SsttdT interneuron CUS and human MDD transcriptional patterns.
a Venn diagrams show overlap between SsttdT male CUS DEGs and SsttdT control female DEGs. 465 transcripts overlap between the two lists (p < 0.0001, exact hypergeometric probability). The bar graph shows the number of transcripts that are up or downregulated and the number that overlap in change and direction. There are 90 genes that were upregulated (55 overlapped and 35 no overlap). There are 375 genes that were downregulated (352 overlapped and 23 did not). Pathway analysis of the 465 overlapping transcripts reveals enrichment for EIF2 signaling (lower panel). b Transcript overlap between human males with MDD and control human females. The 1607 overlapping transcripts (p < 0.0001, exact hypergeometric probability) were analyzed for pathway enrichment (bottom panel). Middle bar graphs show the overlap in expression change between control females and male MDD subjects. Only 2 transcripts of 908 did not overlap for the upregulated direction and only 3 transcripts of 700 did not overlap in the downregulated direction

