Fig. 9.
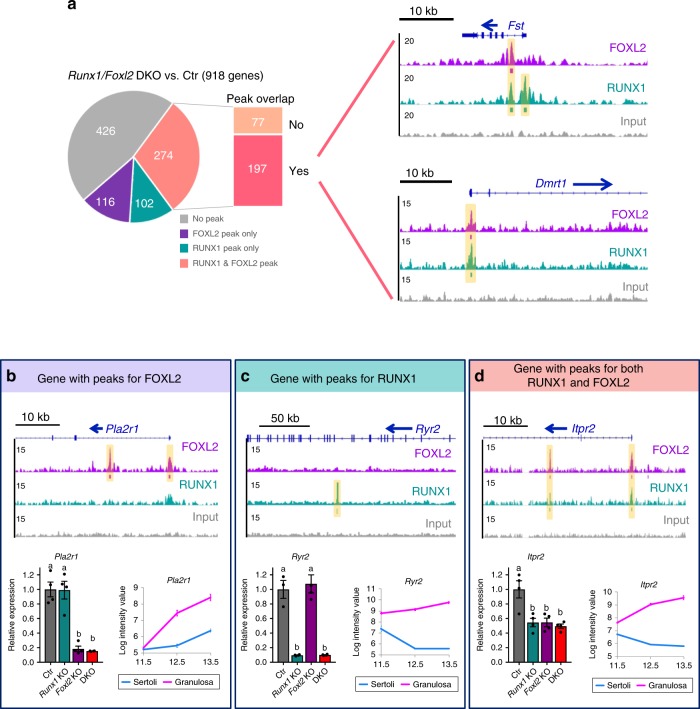
Identification of potential direct target genes for RUNX1 and/or FOXL2. a Pie-chart identifying the genes significantly changed in XX Runx1/Foxl2 DKO gonads that are nearest to peaks for FOXL2 and/or RUNX1. Genome browser view of two key genes significantly changed in XX Runx1/Foxl2 DKO gonads and bound by RUNX1 and FOXL2 in E14.5 ovaries. Blue arrows: gene orientation; orange highlighted area: significant binding peaks identified by HOMER. b–d Examples of genes affected in XX Runx1/Foxl2 DKO gonads and bound by FOXL2 or/and RUNX1. For each gene, we show the genome browser view of RUNX1 and/or FOXL2 binding in E14.5 ovaries, the gene expression by quantitative PCR in XX Runx1/Foxl2 single and double knockouts gonads at E15.5 (n = 4/genotype; mean ± SEM; one-way ANOVA, p < 0.05.; bars with different letters (a, b) are significantly different) and the gene expression in fetal Sertoli and granulosa cells from E11.5 to E13.540. Source data are provided as a Source Data file

