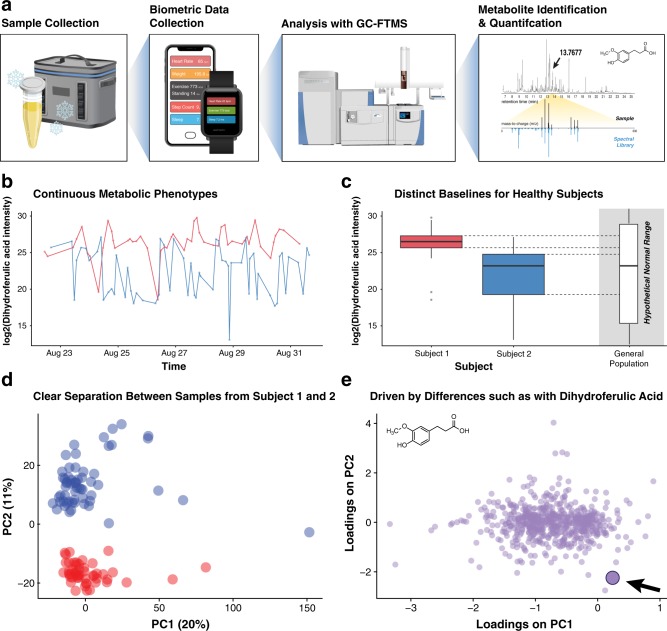
Fig. 1.
GC-MS metabolomics provides continuous and distinct metabolic phenotypes for two healthy individuals. a Every urine sample (109 total; Subject 1 [red], n = 50; Subject 2 [blue], n = 59), along with biohealth data from smartphone applications, was collected for 10 days. Samples were dried down, derivatized with n-methyl-n-(trimethylsilyl)trifluoroacetamide, and analyzed with high resolution GC-Fourier Transform Mass Spectrometry (FTMS). b Deconvolution and quantification with in-house software27,28 provide time series profiles for 603 metabolite features. c The log2-intensity of a metabolite feature identified as dihydroferulic acid, a known endogenous urine metabolite, revealed different baseline concentrations for Subject 1 and Subject 2, compared to a hypothetical range for the general population. d Scores plot from principal component analysis (PCA) based on log2-normalized intensity values shows clear separation between Subject 1 and Subject 2. Each point represents a sample and is colored by Subject. e PCA loadings plot where each point represents a metabolite feature. Explained variance values of PC1 and PC2 are represented as a percentage in parentheses. An interactive version of d and e are provided in the companion webtool

