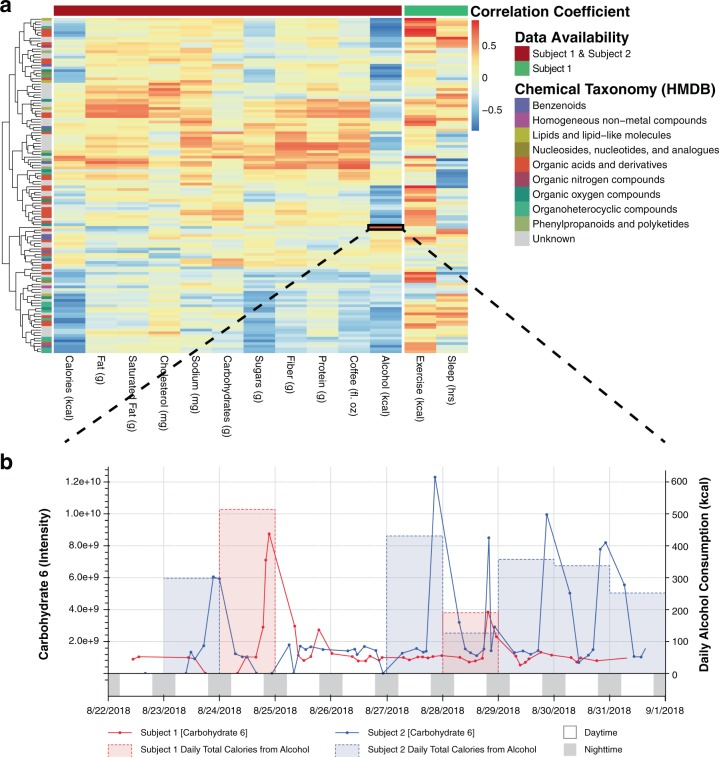
Fig. 3.
Urine metabolites reflect patterns of health and lifestyle. a Heatmap whereby each cell represents the strength of correlation between daily average metabolite intensity and each biometric data collected from smartphone apps. Repeated measures correlation33 was used where data was available for both subjects whereas Robust Spearman’s Correlation34 was used for data only available for Subject 1 (i.e., exercise and sleep). b An example correlation (r = 0.812, p = 1.32e−4, q = 0.0120, dof = 14) between alcohol consumption (in kcals) and a carbohydrate compound (“carbohydrate 6”), most likely representing xylitol. An interactive version of b is provided in the companion webtool

