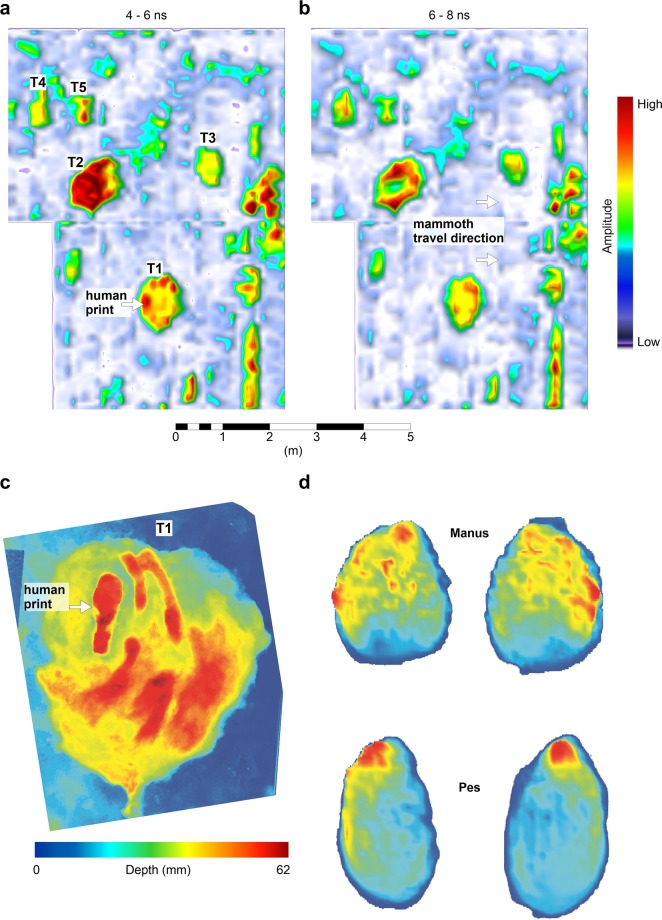
Figure 6.
Location- 2 GPR slices at given travel-times with comparative data. Each 2 ns slice represents an estimated thickness of 5–6 cm. (a) Bottom or near bottom of true tracks, with a superimposed human footprint seen in the perimeter of T1. (b) Slice immediately beneath the tracks yield amplitude patterns similar to observed plantar pressure data. (c) Depths derived from excavation of the largest mammoth track (T1) with human print. (d) Mean plantar pressure data from African elephants (Loxodonta africana), curtesy of Panagiotopoulou et al.20. This based on the mean records of five elephants and the methods are described in Panagiotopoulou et al.20. Means for each of the five animals are based on between 1 and 24 pressure records.

