Figure 2.

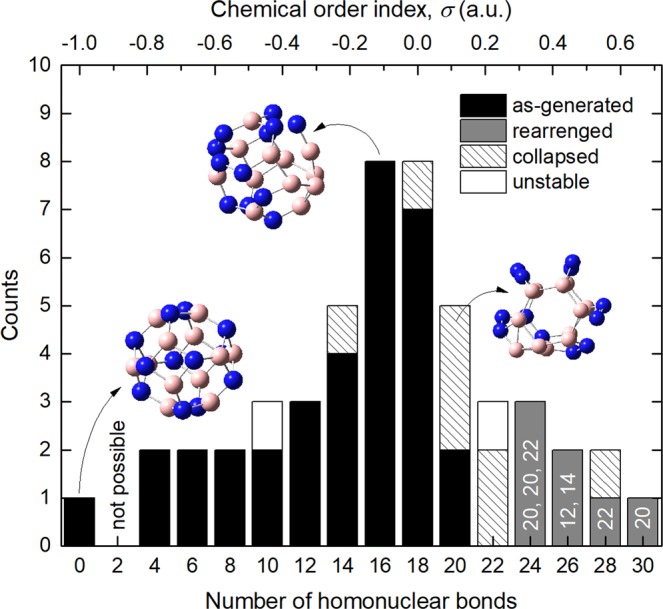
Histogram of the number of homonuclear bonds in a sample of B12N12 fullerene isomers after geometry optimization (sample size: 50). The labels in the gray bars indicate the final number of homonuclear bonds in those rearranged fullerenes.

Histogram of the number of homonuclear bonds in a sample of B12N12 fullerene isomers after geometry optimization (sample size: 50). The labels in the gray bars indicate the final number of homonuclear bonds in those rearranged fullerenes.