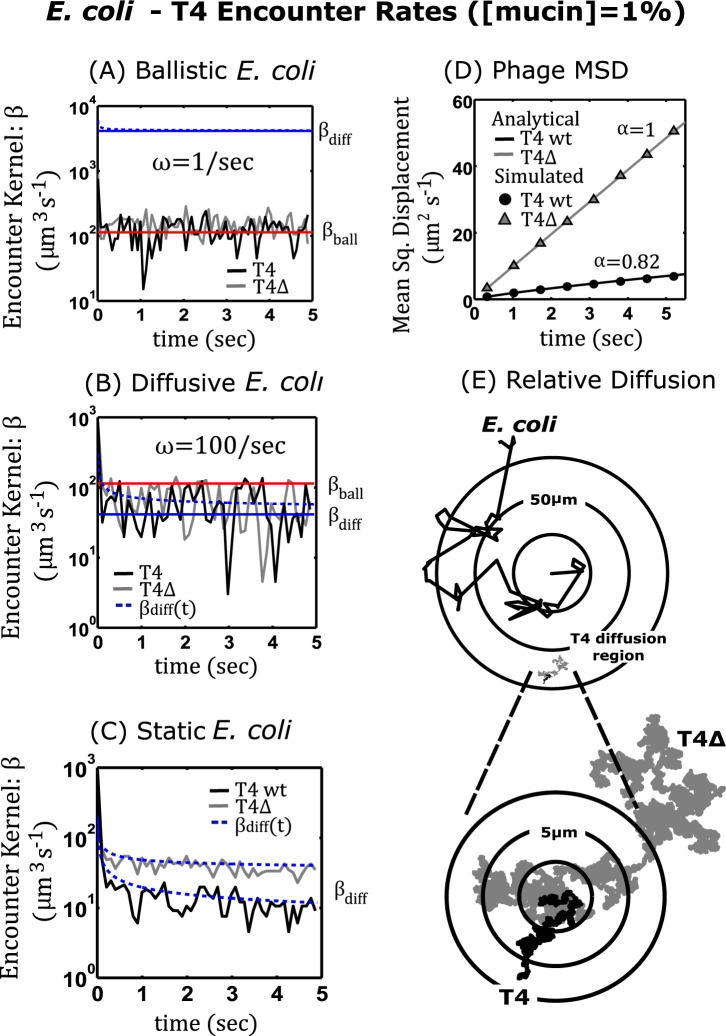
Figure 3.
E. coli-T4 Encounter Rates . Panels (A–C) are plots of the E. coli -T4 encounters per unit time and the corresponding encounter kernels: βball (ballistic)–shown in red, βdiff (diffusive)–shown in blue, as a function of time (solid lines–steady state, dashed lines–transient) for three different motility regimes of E. coli. (A) The simulated data for ballistic E. coli with a small tumble frequency which physiologically corresponds to the bacterium swimming for long duration. (B) Diffusive E. coli with large tumble frequency or short swim times. (C) Static E. coli not swimming . The black curve corresponds to T4 wild type, and the grey curve corresponds to T4Δhoc. (D) Analytical and simulated mean squared displacement for T4 wild type and T4Δhoc using the subdiffusion exponents observed empirically at . (E) The bottom right image displays 2D projections of 43.3 sec trajectories for E. coli, T4 wild type, and T4Δhoc at a ∼50 μm scale. The inset displays both phage trajectories at a higher resolution (∼5 μm).

