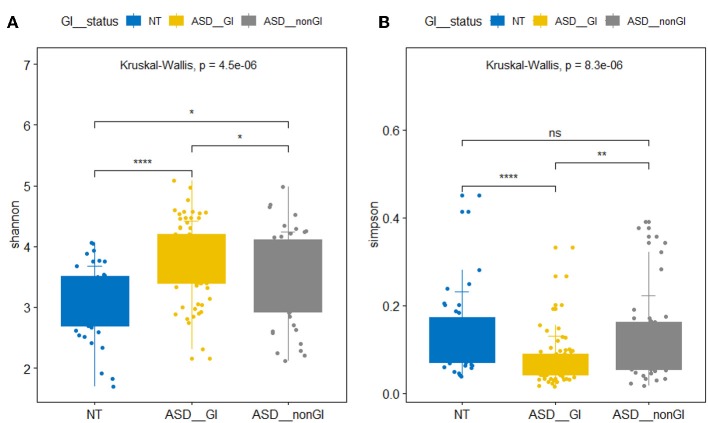
Figure 1.
Box plots of α diversity of intestinal flora. (A) Shannon index. (B) Simpson index. NT represents neurotypical subjects. ASD_GI and ASD_nonGI represent autistic subjects with and without gastrointestinal symptoms, respectively (Kruskal-Wallis test, p < 0.05). *P < 0.05, **P < 0.01, ****P < 0.001.

