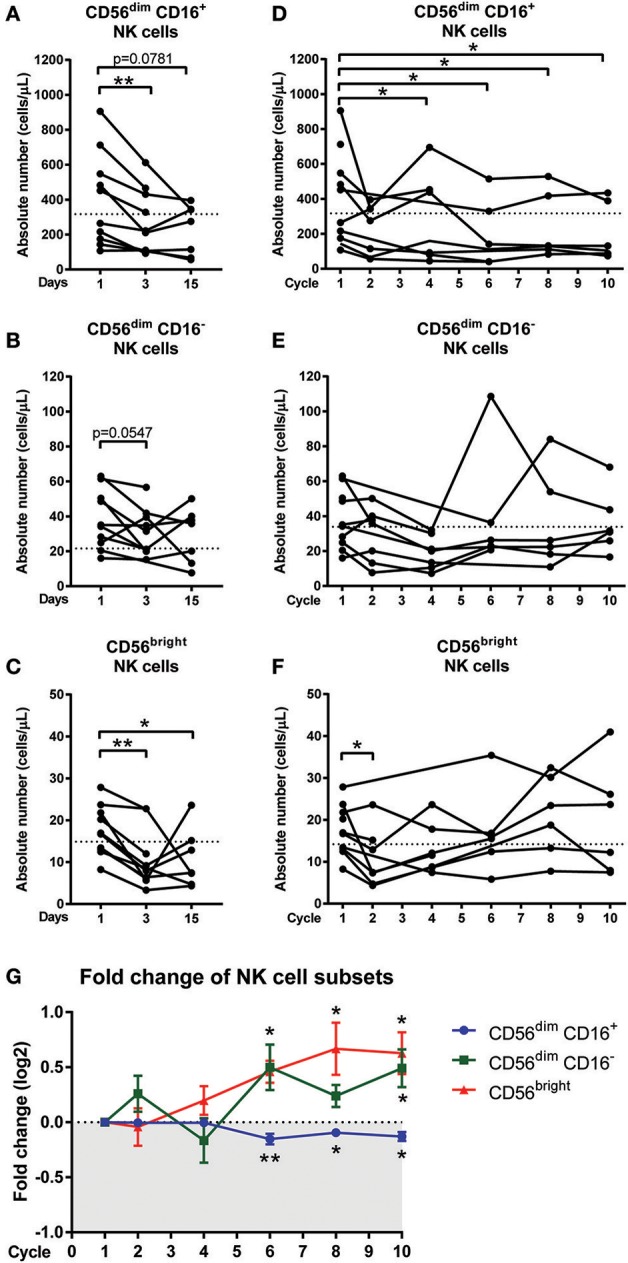
Figure 3.

Changes in NK cell sub-populations following chemotherapy treatment. Blood samples collected on day 1 (pre-treatment), day 3, and day 15 of the first cycle in CRC patients undergoing FOLFOX chemotherapy. Blood samples from later cycles were also collected to test the long term effect of chemotherapy. The absolute numbers of (A) CD56dim CD16+, (B) CD56dim CD16−, and (C) CD56bright NK cells on days 1, 3, and 15 and the absolute numbers of (D) CD56dim CD16+, (E) CD56dim CD16−, and (F) CD56bright NK cells throughout the later cycles of chemotherapy were statistically analysed using Wilcoxon test. (G) The fold change in the frequency of NK cell sub-populations as a percentage of total NK cells over the baseline levels were determined throughout the later cycles of chemotherapy and data presented as mean ± SEM. *p < 0.05, **p < 0.01. n = 10.
