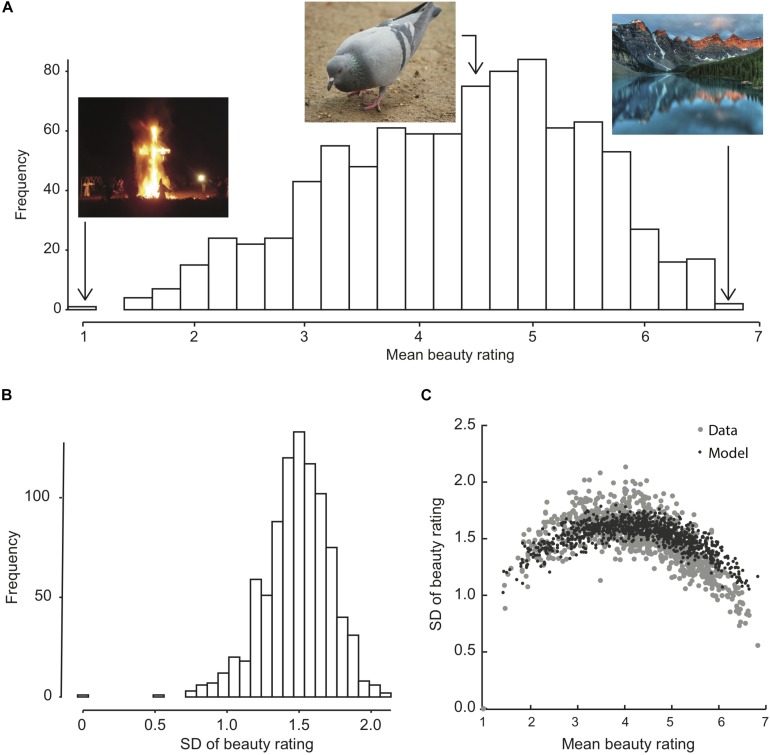
FIGURE 2.
Distribution, across images, of the mean and SD across observers of the beauty rating for each image (A,B), and their relation (C). Example images in (A) show the lowest and highest rated images as well as one of the images receiving the median average rating of 4.45. OASIS allows for the free use of images in online and offline research studies as they are not subject to copyright restrictions. (C) Compares the data (gray dots) with a model prediction (black dots) is based on 190 simulated beauty ratings per image (as many as the average number of participant ratings per image), drawn from a normal distribution with a mean equal to the mean beauty of each image and an SD of 1.7, and rounded to the nearest allowed integer response 1–7.

