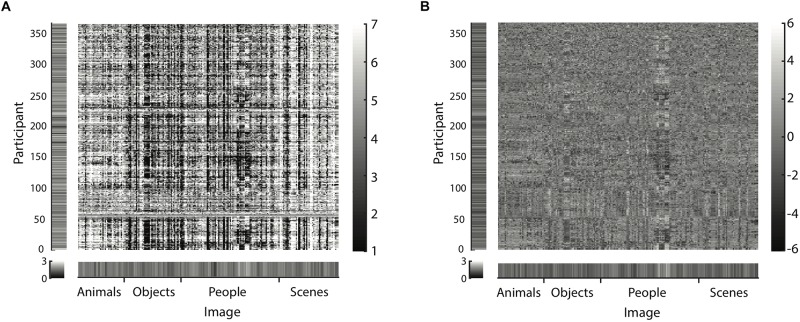
FIGURE 6.
Exemplary matrix of raw data (A) and residuals for the model specified by Eq. 2 (B) for image set 1 (225 images). Matrices for all other image sets are available as Supplementary Figures S1, S2. Data and residuals are sorted according to image category and name on the horizontal axis. Along the vertical axis, participants were sorted according to correlations between residuals: The first observer displayed at the bottom was picked randomly; for the next displayed participant, we picked from the remaining participants the one most correlated with the current one; and so on. Lighter areas indicate higher ratings (A) or residuals (B), darker areas lower ones. Margins indicate the SD of beauty ratings (A) and residuals (B) per participant along the vertical axis and per image along the horizontal axis. The salient vertical and horizontal stripes in (A) reveal similar ratings across images and across participants (raters). The apparently random distribution of residual values in (B) suggests that the model predictions have relatively little systematic error.

