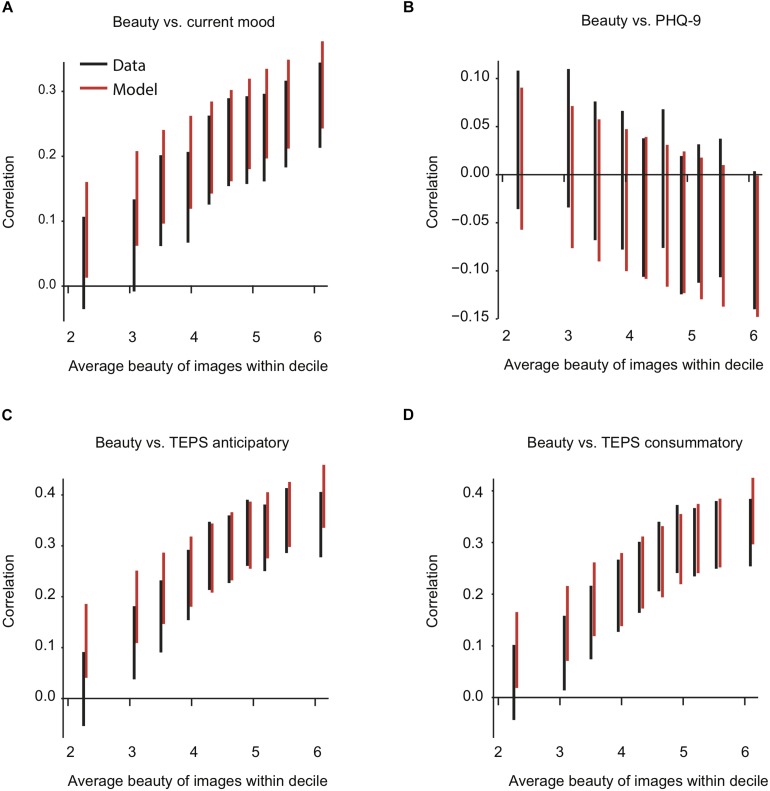
FIGURE 7.
Vertical 95% confidence interval (CI) of the correlation coefficient of average beauty rating vs. mood (A), PHQ-9 (B), TEPS anticipatory (C), and TEPS consummatory score (D). Each line represents the CI for one decile. Horizontally, each CI is placed at the average beauty rating within its decile. Black lines represent the data, red lines model predictions based on Eq. 2. The first decile is the 10% of images that were rated lowest in beauty intensity, and so on. Model predictions are shifted rightward to avoid occlusion.

