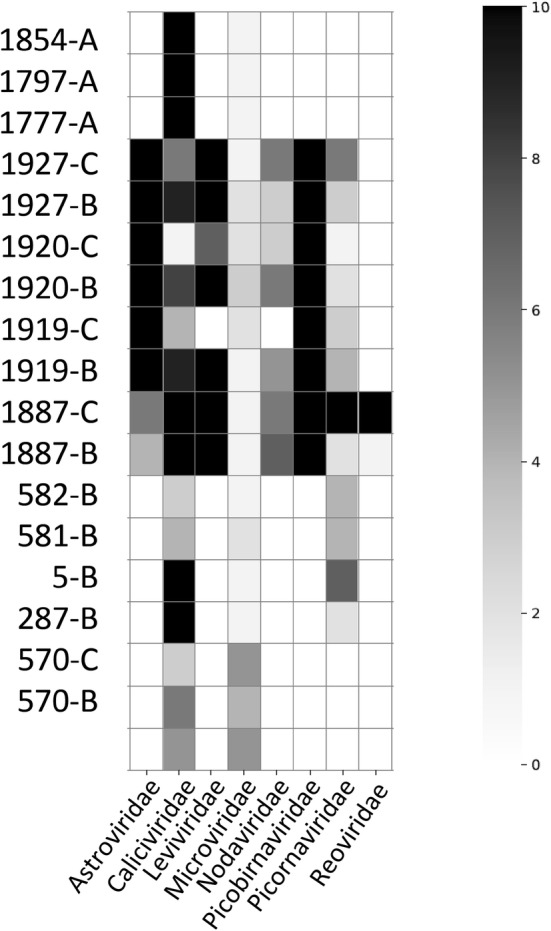
Fig. 2.

Heat map of larger viral contig yield. Quality-controlled short-read data were de novo assembled into large contigs and contigs were classified at the protein level by comparison with virus family-specific reference sets (see Methods). The numbers of contigs in each sample with > 60% protein identity and 500 nt minimum contig length were plotted in a heat map. The colorbar to the right indicates number of contigs detected per sample in each virus family
