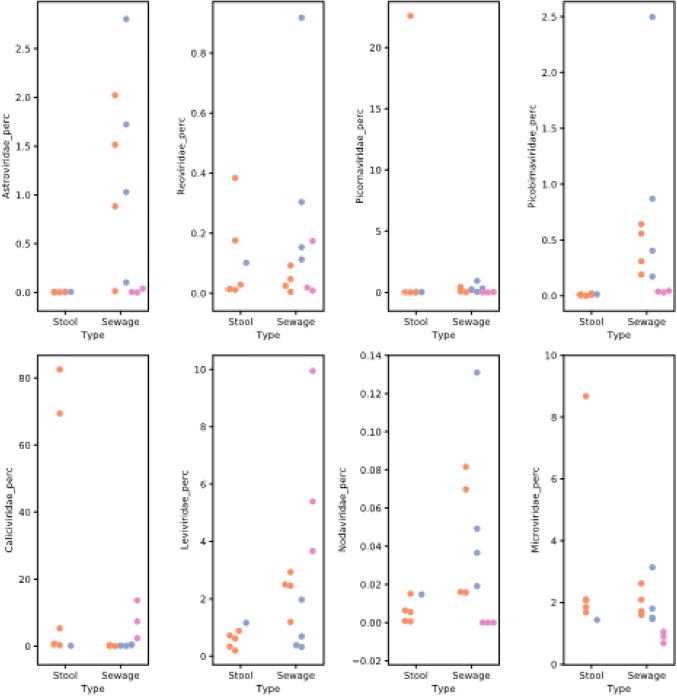
Fig. 3.
Scatter plot of reads identified for each of 8 virus families (percentage of total reads). Quality-controlled reads for each of the 18 sample/conditions were mapped to virus family reference sets (see Methods) for Astroviridae, Caliciviridae, Nodaviridae, Leviviridae, Microviridae, Picornaviridae, Picobirnaviridae and Reoviridae. The number of reads identified in each family was plotted as percentage of the total quality-controlled reads for that read set. Data sets were separated into sample types (stool or sewage) and colored according sample treatment (method A: pink, method B: orange and method C: blue)

