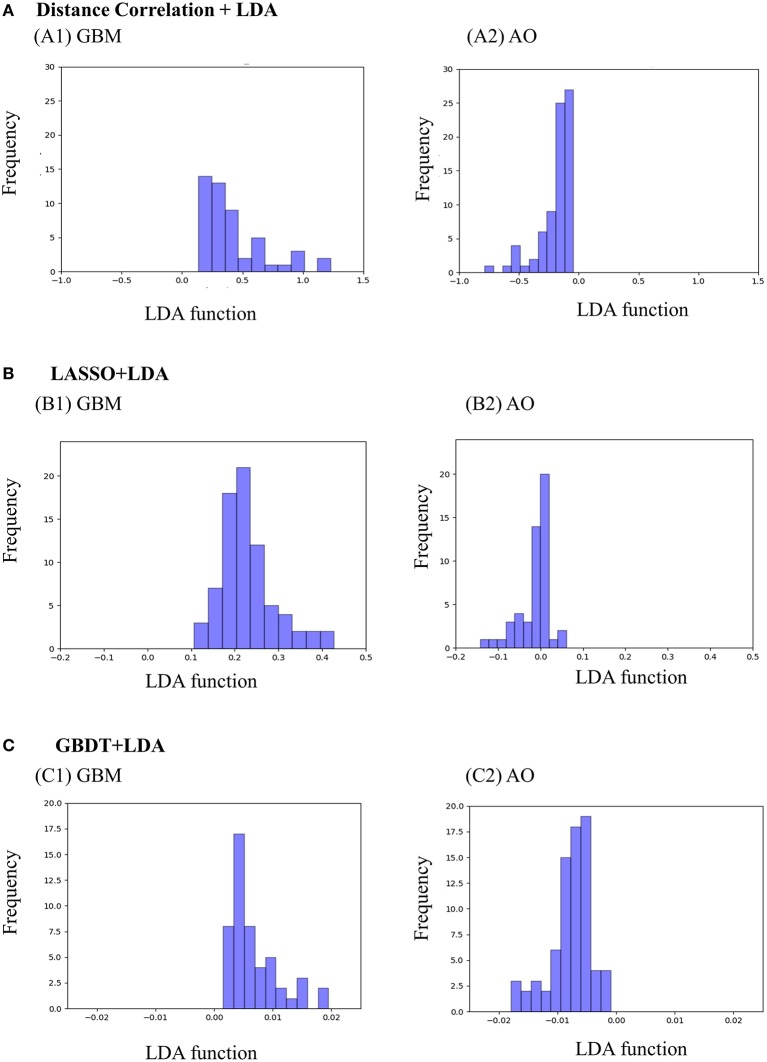
Figure 4.
Examples of performance of the LDA-based models in terms of the distribution of the canonical functions determined for the GBM and AO for two of the 100 independent training cycles in the MRI analysis. Minimal overlap is observed, suggesting high differential ability of the models. (A) Distance Correlation + LDA, (B) LASSO + LDA, (C) GBDT + LDA. GBM, glioblastoma; AO, anaplastic oligodendroglioma; AUC, area under curve; LDA, linear discriminant analysis; LASSO, least absolute shrinkage and selection operator; GBDT, gradient boosting decision tree.

