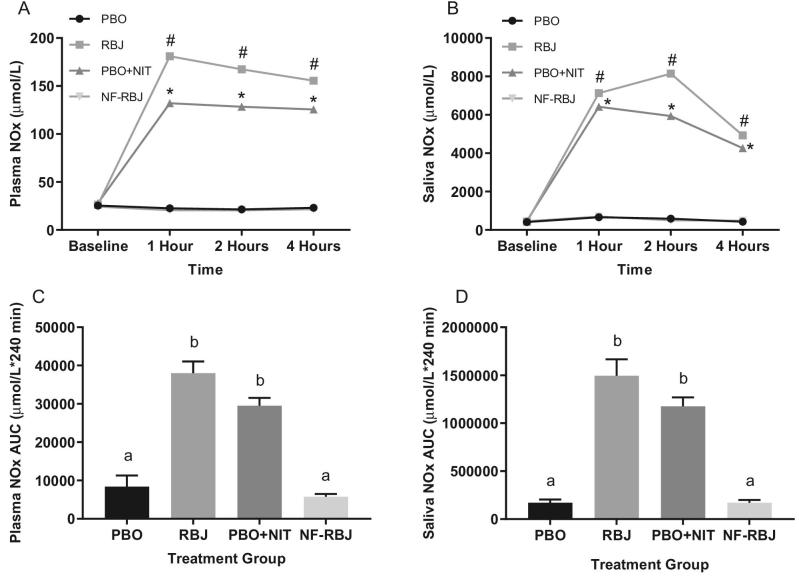
FIGURE 7.
Plasma NOx concentrations (A) and saliva NOx concentrations (B) at baseline (0 h) and 1, 2, and 4 h after a high-fat meal and PBO, RBJ, PBO + NIT, and NF-RBJ treatment ingestion, and postprandial (0–240 min) plasma NOx (C) and saliva NOx (D) AUC at the acute visit. Data in A–C are presented as log-transformed least square means ± SEM, n = 15. Data in D–F are presented as untransformed mean ± SEM. Values in A–C were compared with the use of the PROC MIXED procedure, whereas AUC values in D–F were compared by use of the PROC GLM procedure with Tukey's multiple comparison test in SAS version 9.4. All time points were significantly different than baseline for plasma and saliva NOx concentrations in the RBJ and PBO + NIT groups. Time points annotated with symbols represent significant time*treatment interactions between treatment groups. #RBJ significantly different from PBO and NF-RBJ, P < 0.0001. *PBO + NIT significantly different from PBO and NF-RBJ, P < 0.0001. Treatment groups annotated with different letters were significantly different from one another, P < 0.05. NOx, nitrate/nitrite; PBO, placebo; RBJ, red beetroot juice; PBO + NIT, PBO + nitrate; NF-RBJ, nitrate-free-RBJ.

