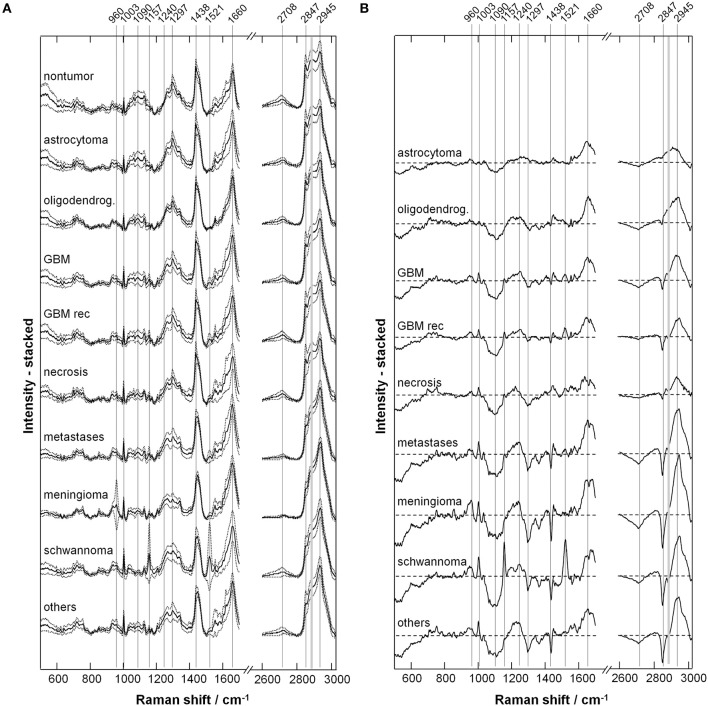
Figure 2.
Extracted Raman signals. (A) Representative spectrum for each tumor type (mean ± SD). (B) Difference spectrum (tumor—non-tumor). The bands indicated by gray lines show variations between neoplastic and non-neoplastic tissue; their assignment is given in Table 2.

