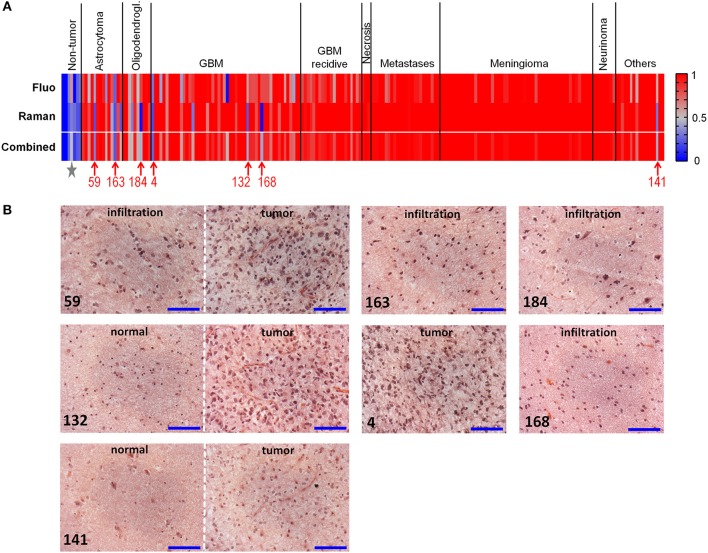
Figure 4.
Classification of neoplastic vs. non-neoplastic brain tissue. (A) Classification of biopsies obtained from fluorescence and Raman data, and combined classification obtained by performing a mean of probabilities based on fluorescence and Raman data. Probability = 1 corresponds to neoplastic tissue (red). Probability = 0 corresponds to non-neoplastic tissue (blue). Misclassified tumor biopsies are indicated with the patients' number; the star indicates the non-neoplastic biopsy of patient 83, which was misclassified based on fluorescence data. (B) Hematoxylin and eosin staining of misclassified biopsies. Patients 59 and 163: diagnosis of astrocytoma WHO grade III; patient 184: diagnosis of oligodendroglioma WHO grade III; patients 4, 132, and 168: diagnosis of GBM; patient 141: diagnosis of dysembryoplastic neuroepithelial tumor WHO grade I. Biopsies of patients 59, 132, 141, 168, 184 contained the infiltration border, including tumor and/or regions of normal tissue; the biopsy of patient four was entirely tumor. Scale bar: 100 μm.

