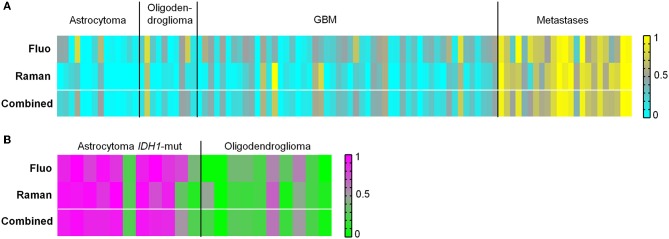
Figure 5.
Classification of tumor types. (A) Classification of biopsies of glioma vs. biopsies of brain metastases obtained from fluorescence and Raman data, and combined classification obtained by performing a mean of probabilities based on fluorescence and Raman data. Probability = 1 corresponds to metastases (yellow). Probability = 0 corresponds to glioma (cyan). (B) Classification of biopsies of astrocytoma IDH1-mut vs. biopsies of oligodendroglioma obtained from fluorescence and Raman data, and combined classification obtained by performing a mean of probabilities based on fluorescence and Raman data. Probability = 1 corresponds to astrocytoma (pink). Probability = 0 corresponds to oligodendroglioma (green).

