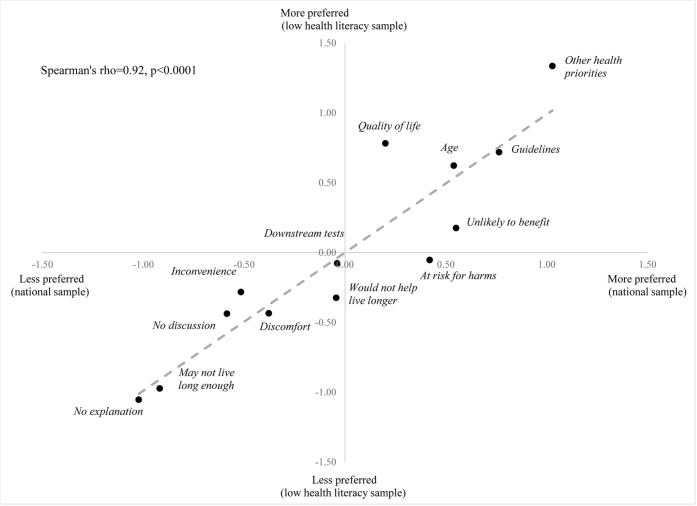
Fig. 1.
Scatter plot of the preference weights for each phrase among the two sample groups. The x-axis shows the preference weights for the national survey sample and the y-axis shows the preference weights for the low health literacy sample. **Preference weights are the coefficients from conditional logistic regression models. Higher preference weight indicates stronger preference; low health literacy sample is adjusted to account for scale differences (k = 1.52).

