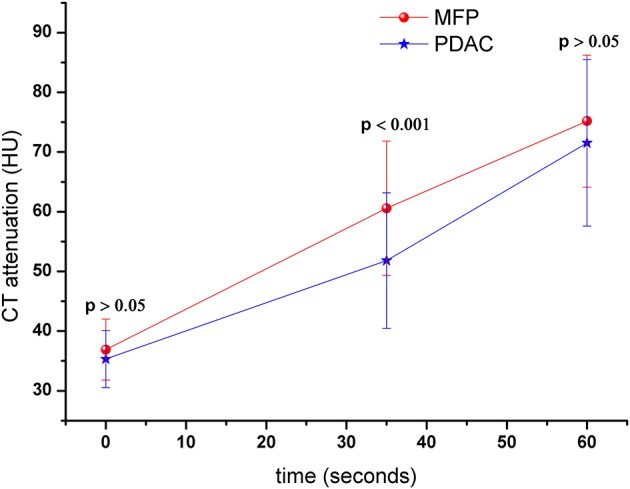
Figure 5.

Dynamic contrast-enhanced curves of patients with MFP and PDAC. CT attenuation of MFP and PDAC was 41.52 ± 5.79 and 42.00 ± 5.37 Hounsfield units in unenhanced phase, respectively. CT attenuation of MFP was higher than PDAC in arterial phase (p < 0.001).
