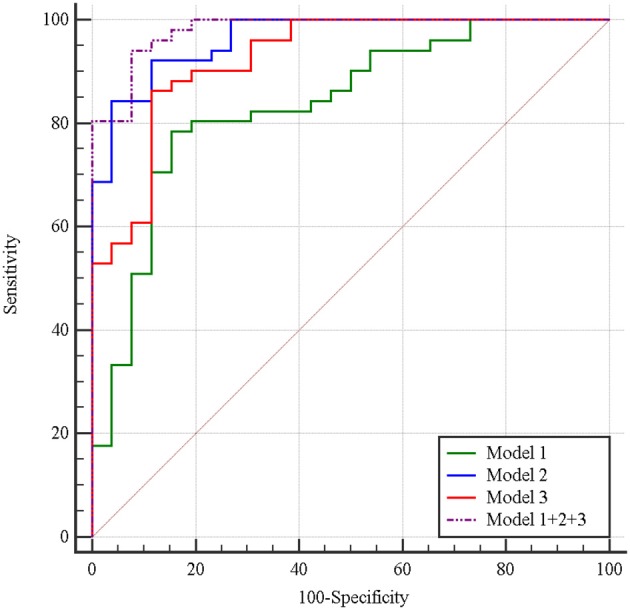
Figure 7.

Receiver operating characteristic curves of imaging feature-based (Model 1), texture feature-based models in arterial phase (Model 2), and portal phase (Model 3), and the combined model (Model 1 + 2 + 3) in differentiating MFP from PDAC. The areas under the curve were 0.84, 0.96, 0.93, and 0.98, respectively.
