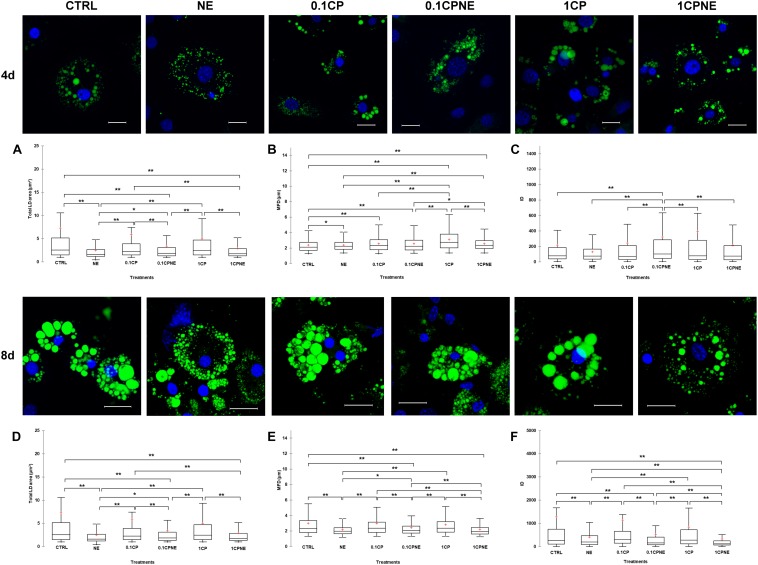
FIGURE 2.
Lipid droplets formation stained with BODIPY 493/503 in fixed 3T3-L1 cells at 4 and 8 days of differentiation. Nuclear staining DAPI. Images are representative of n. 5 biological replicates. (A–F) Lipid droplets box plots show median (horizontal lines), first to third quartile (box), and the most extreme values with the interquartile range (vertical lines). For all comparison, differences between treatments on 3T3-L1 cells were statistically significant, using Kruskal–Wallis test. (A) Total LD area surface at 4 days; (B) Maximum Feret diameter (MFD) at 4 days; (C) Intensity optical density (IOD) at 4 days. (D) Total LD area surface at 8 days; (E) Maximum Feret diameter (MFD) at 8 days; (F) Intensity optical density (IOD) at 8 days. The area surface measures are expressed in μm2 and MFD μm. Measures are the average of 1224 and 853 observations at 4 at 8 days, respectively. ∗∗p < 0.0001; ∗p < 0.05. Scale bars: 20 μm. CTRL = vehicle negative control; NE = 10 μM norepinephrine; 0.1CP = 0.1 μM capsaicin; 0.1CPNE = 0.1 μM capsaicin plus 10 μM norepinephrine; 1CP = 1 μM capsaicin; 1CPNE = 1 μM capsaicin plus 10 μM norepinephrine.

