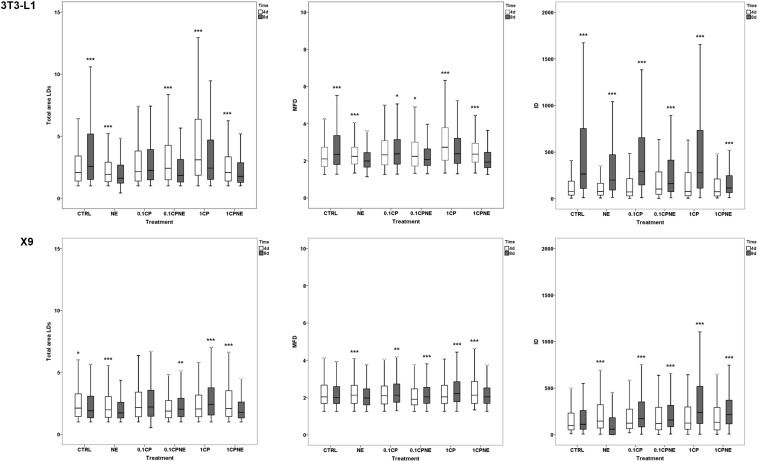
FIGURE 4.
Pairwise comparison of total area surface, MFD and IOD between the same treatment after 4 (4d) and 8 days (8d) of differentiation within 3T3-L1 cells and X9 cells. Box plots show median (horizontal lines), first to third quartile (box), and the most extreme values with the interquartile range (vertical lines). For all comparison, differences between days of differentiation of 3T3-L1 and X9 cells were statistically significant using Kruskal–Wallis test. The measurements are the average of 10 fields of each developmental stage. ∗∗∗p < 0.0001, ∗∗p < 0.01, ∗p < 0.05. CTRL = vehicle negative control; NE = 10 μM norepinephrine; 0.1CP = 0.1 μM capsaicin; 0.1CPNE = 0.1 μM capsaicin plus 10 μM norepinephrine; 1CP = 1 μM capsaicin; 1CPNE = 1 μM capsaicin plus 10 μM norepinephrine.

