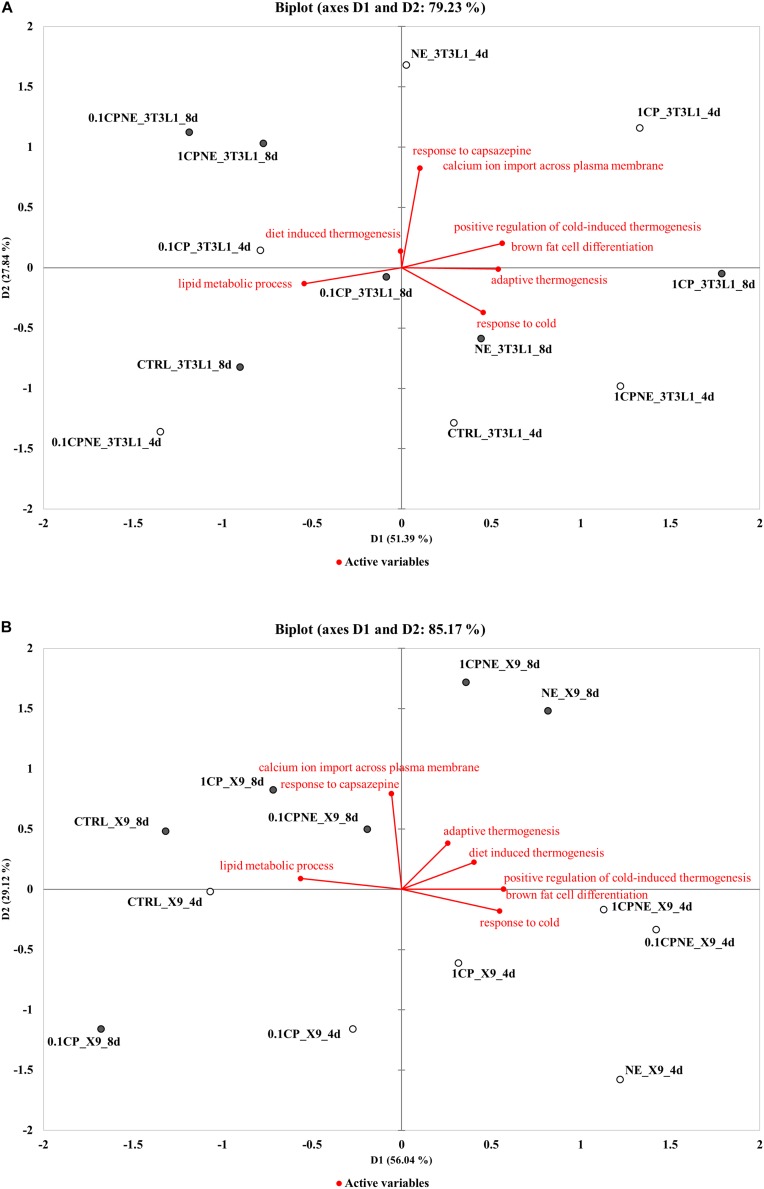
FIGURE 5.
Distance biplots of principal component analysis (PCA) to summarize and visualize the information of the data set containing the treatments (points, active observations) and biological process BPs (vectors, active variables) in (A) 3T3-L1 cells at 4 and 8 days and in (B) X9 cells at 4 and 8 days.

