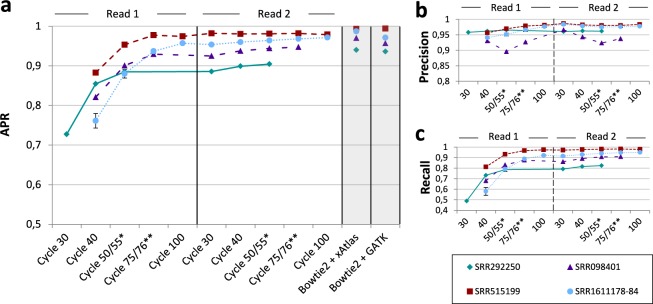
Figure 1.
Area under a precision-recall curve (APR) for SNP calling in seven data sets at different sequencing cycles. SNP calling was performed with xAtlas using real-time read mapping results of HiLive2. Results for the samples SRR1611178, SRR1611179, SRR1611183 and SRR1611184 were combined to a single data series due to their high similarity (SRR1611178-84). Error bars for this data series show the standard deviation. Reads of SRR292250 and SRR098401 were shorter than 2 × 100 bp which leads to missing data points. The vertical, ticked line in the middle of the plot divides the first and second read. (a) The gray columns show APR values using Bowtie 2 for read mapping and xAtlas (left) and GATK (right) for variant calling. The data for Bowtie 2 + GATK were taken from Hwang et al.18. The real-time workflow with HiLive2 and xAtlas provides first results after 40 sequencing cycles (30 cycles for SRR292250). An APR greater than 0.9 is reached after 75 cycles for all data sets with a minimal read length of 75 bp. Until end of sequencing, there is a moderate increase of the APR. (b) Precision with a quality threshold of 1 for variant calling with xAtlas. The results show no precision lower than 0.89 for all sequencing cycles. In general, precision increases only slightly over time. This indicates that results in early sequencing cycles are already reliable. (c) Recall with a quality threshold of 1 for variant calling with xAtlas. The results show strong improvements from the first results available until the end of the first read. The progression of all curves is similar to that of the APR curve (cf. a), indicating the correlation between those two measures. *Cycle 50 for SRR292250, cycle 55 for all other data sets. **Cycle 76 for SRR098401, cycle 75 for all other data sets.

