Figure 1.
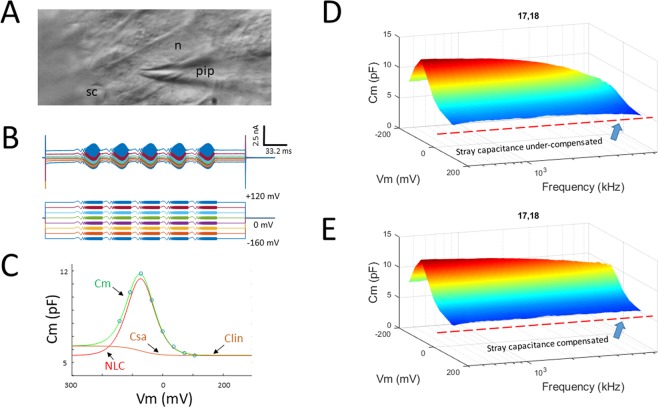
High frequency measurement of OHC NLC in organ of Corti explants. (A) Light micrograph of an in situ patch clamped OHC. sc, stereocilia; n, nucleus; pip, patch pipette. (B) Whole cell currents induced by chirp voltage protocol. (C) Derived voltage-dependent capacitance (circles) at each frequency (see methods) was fit to extract NLC and its Boltzmann parameters. (D,E) Surface plots of raw Cm data before (D) and after (E) correction for residual stray capacitance effects on high frequency measures. Note frequency independence of Clin following correction.

