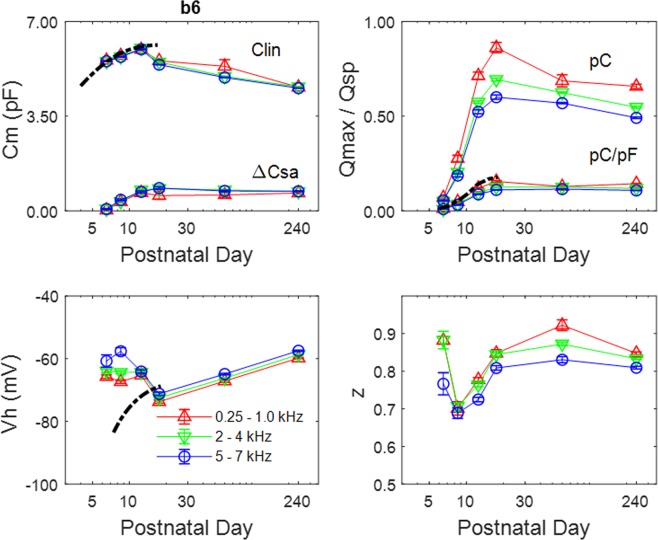
Figure 4.
Boltzmann characteristics (mean +/− se) for selected bandwidths. The dashed line denotes NLC measured at low frequencies from isolated OHCs (Abe et al., 2010). Note abrupt decline of Clin, while Csa remains steady. Vh is initially at a more positive potential than isolated cells. Qmax (pC) and Qsp (pC/pF) increase rapidly during development. Qmax decreases after p17/18, with a clear difference between low and high frequencies, but Qsp stabilizes because of the Clin drop. Following some variability at p6/7, z increases with age, and also tends to be smaller at higher frequencies. P6,7 n = 7; p8,9 n = 7; p12,13 n = 6; p17,18 n = 8; 2 month n = 8; 8 month n = 9.

