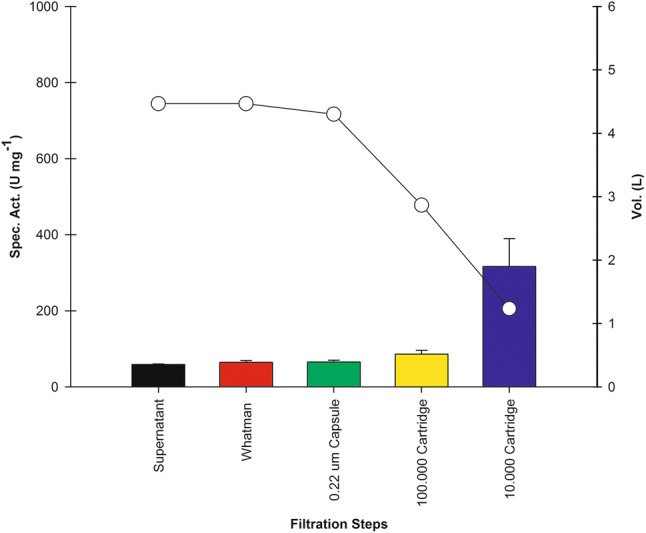
Fig. 4.

Average specific activity obtained from concentrate of three lots at 10 L bioreactor scale. Color bars depict average values of specific activity, at the end of culture in a 10 L bioreactor (supernatant, black bar), followed by different concentration steps. For each step, changes in volume are illustrated (line with open circles). Since the enzyme has an approximate weight of 54.18090 kDa, the filtrate was collected (0.22) for the Whatman, capsule, and 100.000 Dalton steps, whereas for the 10,000 Dalton cassette, the concentrate was collected
