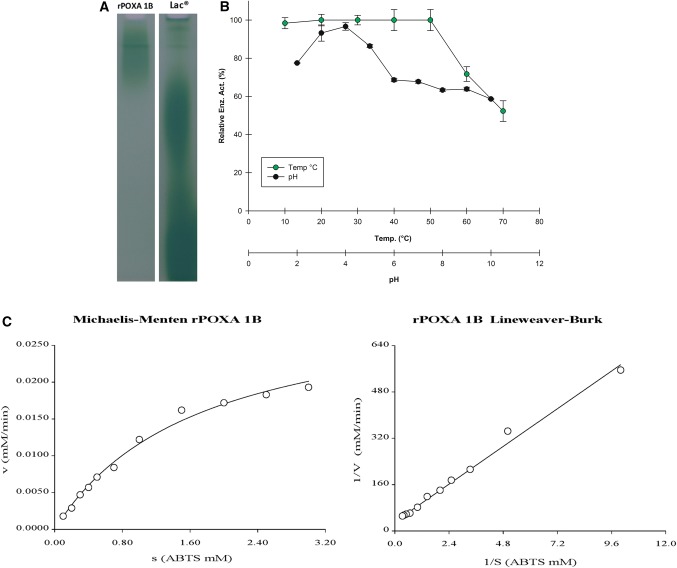
Fig. 5.
rPOXA 1B concentrate characterization. a Zymogram (native-PAGE 12% w/v) identification of functional rPOXA 1B, developed with 0.5 M ABTS. Samples: rPOXA 1B concentrate, Lac®: Positive control Laccase Sigma-Aldrich®. b Temperature and pH effect on relative residual enzyme activity, all assays were performed in triplicate. Relative enzyme activity relates to the enzyme activity at the assay's starting point. c Concentrate of rPOXA 1B enzyme kinetic results, left. Michaelis-Menten graph and right. Lineweaver-Burk plot

