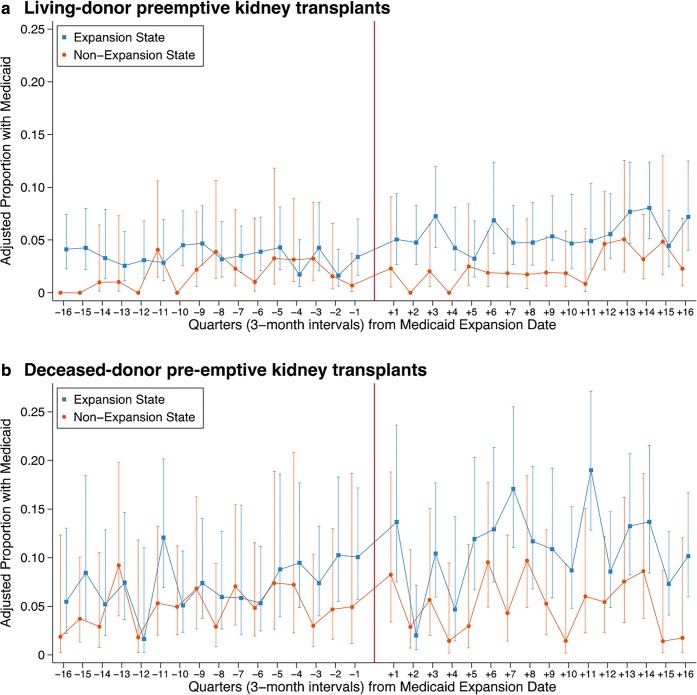
Figure 1.
Adjusted proportion of non-elderly pre-emptive kidney transplants with Medicaid coverage, with 95% confidence intervals. This figure displays results from an age, race, and sex-adjusted logistic regression model for pre-emptive kidney transplant recipient insurance type (Medicaid/other), comparing 19 non-expansion states to 31 expansion states (and the District of Columbia) for (panel a) living-donor pre-emptive kidney transplants and (panel b) deceased-donor pre-emptive kidney transplants. To account for different calendar dates of Medicaid expansion, results are presented as the number of quarters before and after a standardized Medicaid expansion date, where the date of Medicaid expansion is set to equal zero. The point estimate for each quarter indicates the adjusted proportion of all pre-emptive transplants in that quarter that was Medicaid-covered. The solid line indicates the calendar date of Medicaid expansion for expansion states, and January 1, 2014 for non-expansion states. Blue squares represent proportions of Medicaid-covered pre-emptive transplants in expansion states, with 95% confidence intervals. Red circles represent proportions of Medicaid-covered pre-emptive transplants in non-expansion states, with 95% confidence intervals.

