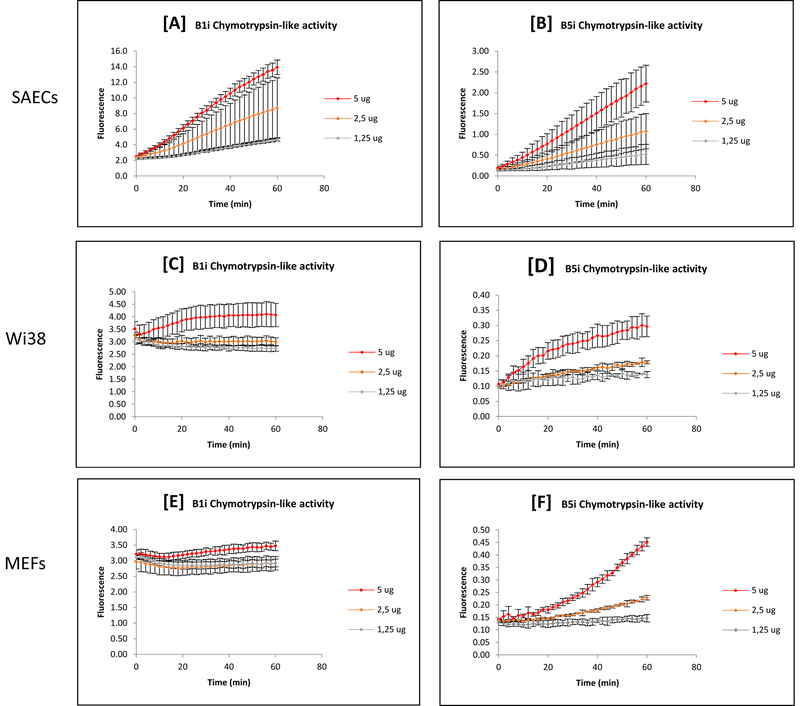
Figure 2: Effect of Varying Cell Protein Sample and Measurement Time on Apparent Immuno-Proteasomal Proteolysis.
Different amounts of cell protein were loaded in order to test the proteolytic response of the Immuno-Proteasome over time in each cell type (A, B, C, SAECs; D, E, F, Wi38; G, H, J, MEFs). Different amounts of cell protein resulted in different apparent Immuno-Proteasomal activities. Kinetic curves provided a range in which to find a linear response (i.e. when the rate of reaction was constant). The results shown here are the mean ± SD of at least 3 independent trials.

