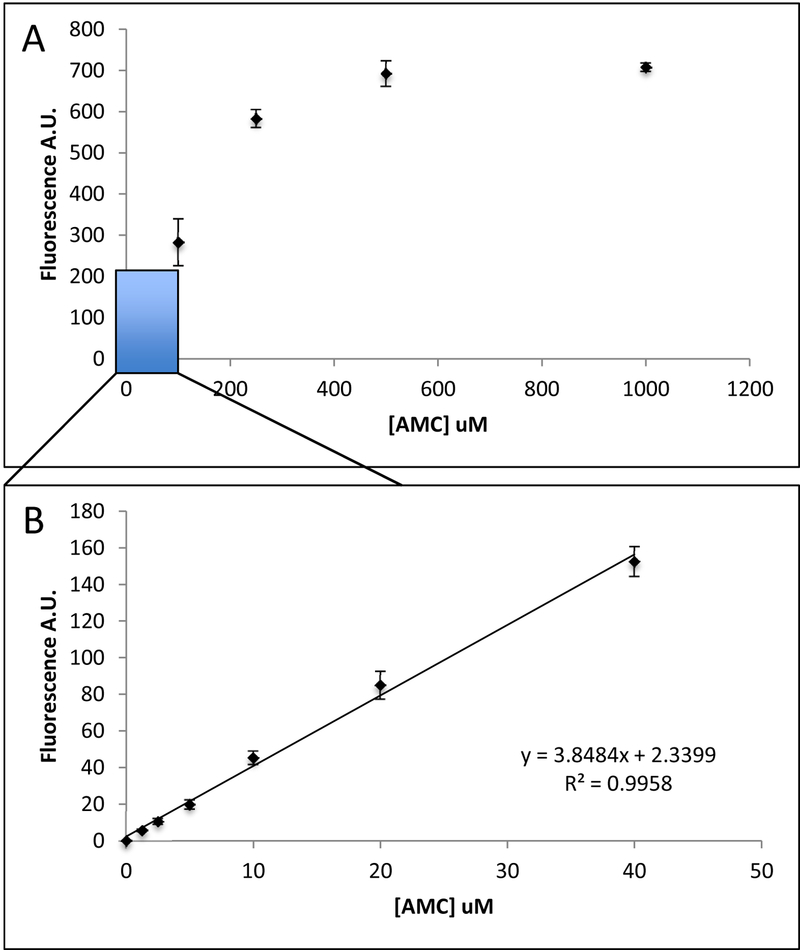
Figure 4: Creating an AMC Standard Curve Against which to Calibrate Rates of Proteolysis.
A: The AMC standard curve has a logarithmic distribution with saturation at high concentrations. B: Low AMC concentrations provide a linear curve well suited for correlating fluorescence to units of AMC, which can then be used to determine proteolytic activity from free AMC. The results showed here are the mean ± SD of at least 5 independent replicates.

