Fig. 1.
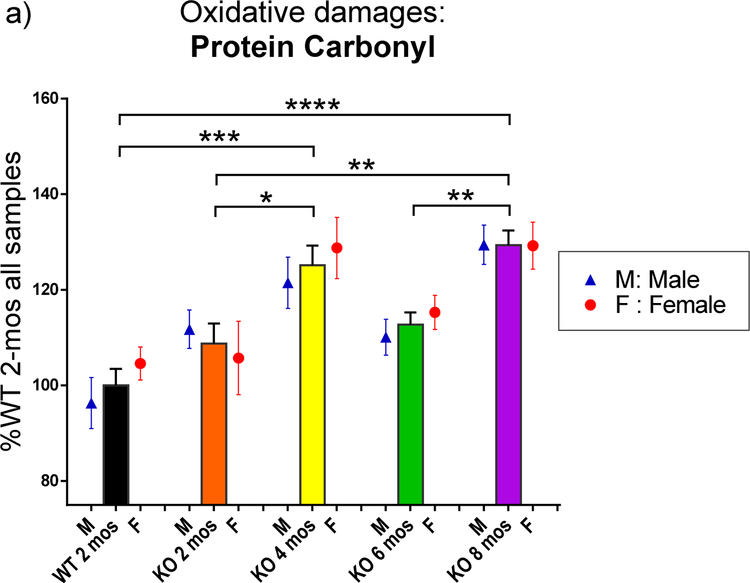
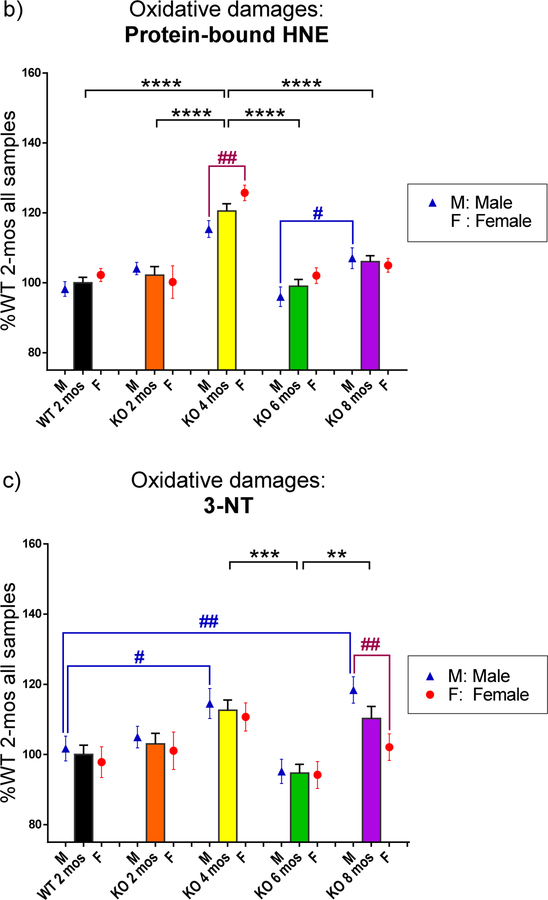
The levels of the biomarker of oxidative damage: protein carbonyl, protein-bound HNE, and 3-NT in the brain of WT and PINK1 KO rats at different ages and genders. The oxidative damage levels were revealed by the intensity on slot blot of each brain sample and normalized the KO groups to the percentage of 2 mos-old WT level for each biomarker. Black stars (*) and significant lines marked the significant changes between different age and genotype groups, consisting of both male and female. Purple # and purple significant lines (in 1-b and 1-c) marked the significant changes between male and female at same age and genotype group. The levels of oxidative damage were affected more in the PINK1 KO rats. Blue # and blue significant lines (in 1-b and 1-c) were used to show significant changes among different age groups for only male rats when the male rats have additional significant changes compared to total sample groups. (a) The protein carbonyl (PC) levels change as age increased with all samples, including both male and female. Both genders follow a similar trend: KO rats reaching a high level at 4 mos of age, decreased at 6 mos, and increased again at 8 mos. WT 2-mos vs. KO 4-mos (***, p<0.001); WT 2-mos vs. KO 8-mos (****, p<0.0001); KO 2-mos vs. KO 4-mos (*, p<0.05); KO 2-mos vs. KO 8-mos (**, p<0.01); KO 6-mos vs. KO 8-mos (**, p<0.01). No significant differences between male and female were found at each age group. (b) The protein-bound HNE (shorted to HNE) levels changed as age increased with all samples, including both male and female. KO 4-mos rats showed a significantly higher level compared to all other groups. KO 4-mos vs. WT 2-mos (****, p<0.0001); KO 4-mos vs. KO 2-mos (****, p<0.0001); KO 4-mos vs. KO 6-mos (****, p<0.0001); KO 4-mos vs. KO 8-mos (****, p<0.0001). All female rat groups followed a similar pattern as the total sample groups with all four significant differences (significant lines were not shown; p<0.0001). However, significant increased HNE levels in KO male brain were observed from the 6 mos-old group to 8 mos-old group (blue #, p<0.05), instead of a significant difference between KO 4-mos group and KO 8-mos group of only males. At the age of 4 mos, a significant gender difference also was observed (purple ##, p<0.01). At this age, female KO rats are more affected by HNE damage than were male rats. (c) The 3-NT levels change as age increased with all samples, including both male and female. Both KO 4-mos group and KO 8-mos group showed significantly higher levels of 3-NT than the KO 6-mos group. KO 4-mos vs. KO 6-mos (***, p<0.001); KO 8-mos vs. KO 6-mos (**, p<0.01). Female rats groups followed a similar pattern as the total sample groups as age increased, but only one significant decreased level of 3-NT was observed in only female rats with increasing age, which is KO 4-mos female vs. KO 6-mos female (significant line was not shown, p<0.05). KO male rats demonstrated more changes in brain 3-NT levels compared to female rats. In addition to KO 6-mos male vs. KO 4-mos male (significant line was not shown, p<0.01) and KO 6-mos male vs. KO 8-mos male (significant line was not shown, p<0.01), significantly increased 3-NT levels also were observed when WT 2-mos male vs. KO 4-mos male (blue ##, p<0.01), and WT 2-mos male vs. KO 8-mos male (blue #, p<0.05). At age of 8 mos, a significant gender difference also was observed (purple ##, p<0.01). At this age, male KO rats were more affected by 3-NT damages than were female rats.
For all data in Figure 1, the numbers of individual rats were: (female WT, N=4; male WT, N=5; for the 2, 4, 6, and 8 mos-old male/ female KO, N= 6,8,8, and 7, respectively).


