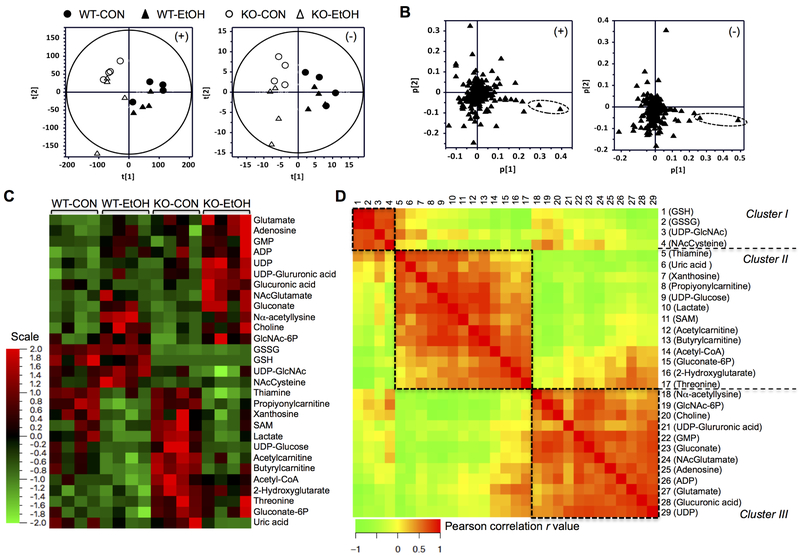
Fig. 1. Global and targeted metabolic profiling of the hepatic polar metabolome.
Metabolomic analyses were conducted in the livers of wild-type (WT) and Gclm-KO (KO) mice pair-fed control (CON) or ethanol-containing (EtOH) diet for six weeks. (A-B) Untargeted metabolic profiling by HILIC/ESI-MS. Scores-scatter plots (A) and loadings plots (B) of principal component analysis of liver weight-normalized metabolic data recorded in positive (left panels) and negative (right panels) modes. (C-D) Targeted metabolite quantitation by UPLC-MS/MS. 29 metabolites showed differential abundance among the four experimental groups. (C) Hierarchy clustering heat map of 29 metabolites. The color key represents values of relative abundance. (D) Pair-wise inter-correlation heat map of 29 metabolites. The color key represents Pearson correlation r values (P < 0.05). WT-CON, wild-type mice fed the control diet; KO-CON, Glcm-KO mice fed the control diet; WT-EtOH, wild-type mice fed the ethanol-containing diet; KO-EtOH, Glcm-KO mice fed the ethanol-containing diet.

