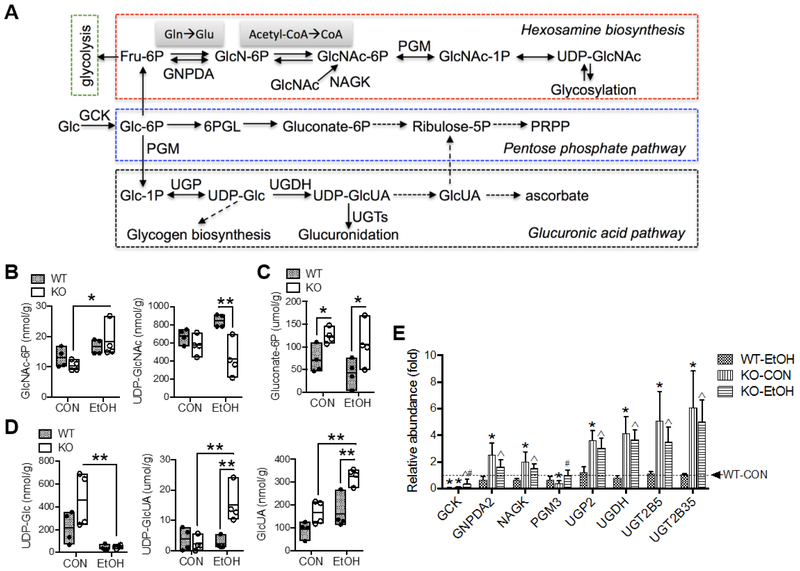
Fig. 5. Alterations in metabolites and gene expression involved in amino sugar metabolism, pentose phosphate pathway and glucuronic acid pathway.
(A) Scheme of selected biochemical reactions and metabolites involved in these pathways. Solid or dashed lines with arrow indicate single or multiple biochemical reactions, respectively. Hepatic concentrations of metabolites of (B) hexosamine biosynthesis, (C) oxidative pentose phosphate pathway, and (D) glucuronic acid pathway. Results are expressed in mole per gram (g) liver weight. Data are presented as floating bars (min to max, line at mean; N = 4/group) showing individual data points from wild-type (WT, closed circles) and Gclm-KO (KO, open circles) mice. *P < 0.05, **P < 0.01, ***P < 0.001 by two-way ANOVA with post-hoc Holm-Sidak's multiple comparisons test. (E) Relative mRNA abundance measured by Q-PCR. Results are expressed as mean ± S.D. (N = 4/group). *Compared to WT-CON, åcompared to WT-EtOH, or #compared to KO-CON: P < 0.05 by two-way ANOVA with post-hoc Holm-Sidak's multiple comparisons test. WT-CON, wild-type mice fed control diet; KO-CON, Glcm KO mice fed control diet; WT-EtOH, wild-type mice fed ethanol-containing diet; KO-EtOH, Glcm KO mice fed ethanol-containing diet; 6PGL, phosphogluconolactonase; Fru-6P, fructose-6-phosphate; Glc, glucose; Glc-1P, glucose-1-phosphate; Glc-6P, glucose-6-phosphate; GlcN-6P, glucosamine-6-phosphate; GlcNAc, N-acetylglucosamine; GlcNAc-1P, N-acetylglucosamine-1-phosphate; GlcNAc-6P, N-acetylglucosamine-6-phosphate; GlcUA, glucuronic acid; Gln, glutamine; Glu, glutamate; PRPP, 5-phosphoribosyl-1-pyrophosphate; UDP-Glc, UDP-glucose; UDP-GlcNAc, UDP-acetylglucosamine; UDP-GlcUA, UDP-glucuronic acid; GCK, glucokinase; GNPDA, glucosamine-6-phosphate deaminase; NAGK, N-acetylglucosamine kinase; PGM, phosphoglucomutase 3; UGDH, UDP-glucose 6-dehydrogenase; UGP, UDP-glucose pyrophosphorylase 2; UGTs, UDP-glucuronosyltransferases.

